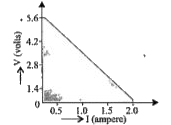
A straight line plot showing the terminal potential difference (V) of a cell as a function of current (1) drawn from it, is shown in the figure. The internal resistance of the cell would be then:
2.8 ohms
1.4 ohms
1.2 ohms
Zero
The correct Answer is:A
We know,
E=V+Ir
at I=0 E=V=5.6 V
at V=0 I=2A
∴E=2r
∴2r=5.6Ω
∴2r−5.6Ω
r=2.8Ω
Topper's Solved these Questions
- BOOK - EDUCART PUBLICATIONCHAPTER - CBSE TERM-1 SAMPLE PAPER 1EXERCISE - SECTION-C6videos
CBSE TERM-1 SAMPLE PAPER 1
- BOOK - EDUCART PUBLICATIONCHAPTER - CBSE TERM-1 SAMPLE PAPER 1EXERCISE - SECTION-C6videos
CBSE TERM-1 SAMPLE PAPER 1
- BOOK - EDUCART PUBLICATIONCHAPTER - SAMPLE PAPER SELF-ASSESSMENT (11)EXERCISE - SECTION -C1videos
SAMPLE PAPER SELF-ASSESSMENT (11)
- BOOK - EDUCART PUBLICATIONCHAPTER - SAMPLE PAPER - 8EXERCISE - Section C6videos
SAMPLE PAPER - 8
Similar Questions
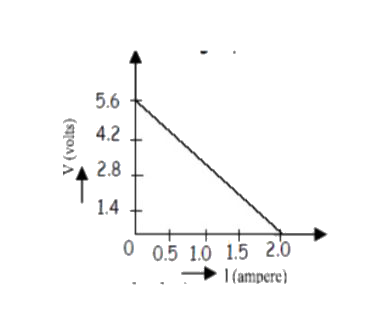
A straight line plot showing the terminal potential difference (V) of a cell as a function of current (I) drawn from it, is shown in the figure. The nternal resistance of the cell would be then-
 View Solution
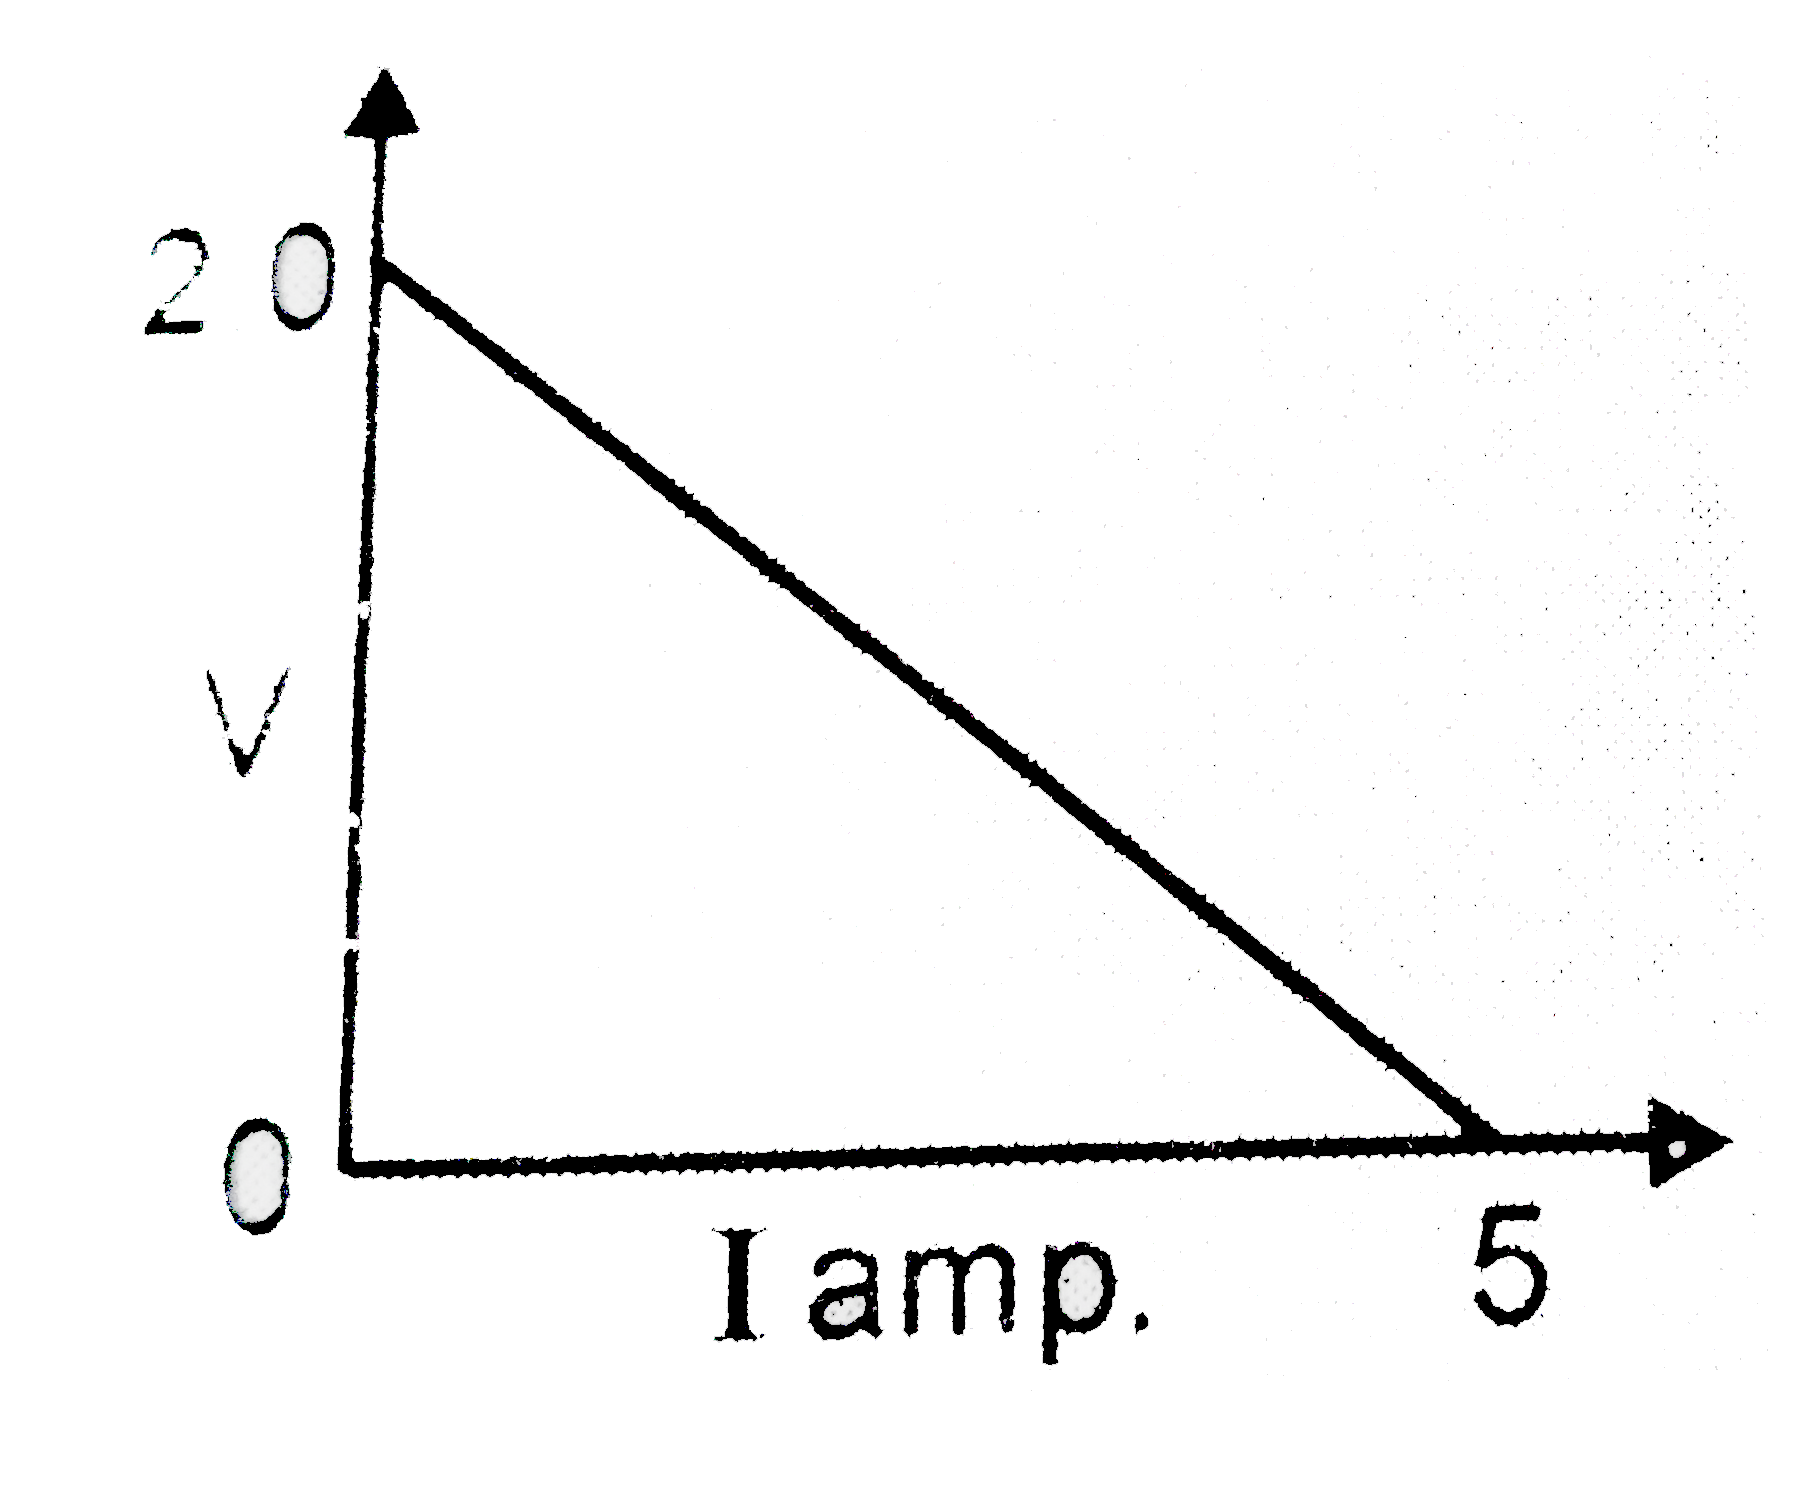
For a cell, the graph between the potential difference (V) across the terminals of the cells and the current I drawn from the cell is as shown in figure. Calculate the e.m.f. and the internal resistance of the cell.
 View Solution
Knowledge Check
- Question 1 - Select One
The terminal potential difference for a cell is 8.5 V when current is 2A and 9 V when current is 1.5A. What is the internal resistance of cell ?
A4ΩB2ΩC3ΩD1Ω - Question 2 - Select One
For a cell, the graph between the potential difference (V) across the terminals of the cells and the current I drawn from the cell is as shown in figure. Calculate the e.m.f. and the internal resistance of the cell.
 A4F3KB3F4KC4FKD2FK
 - Question 3 - Select One
As the current drawn from the cell increases, terminal potential difference of a cell is
AconstantBdecreasesCincreasesDnone of these
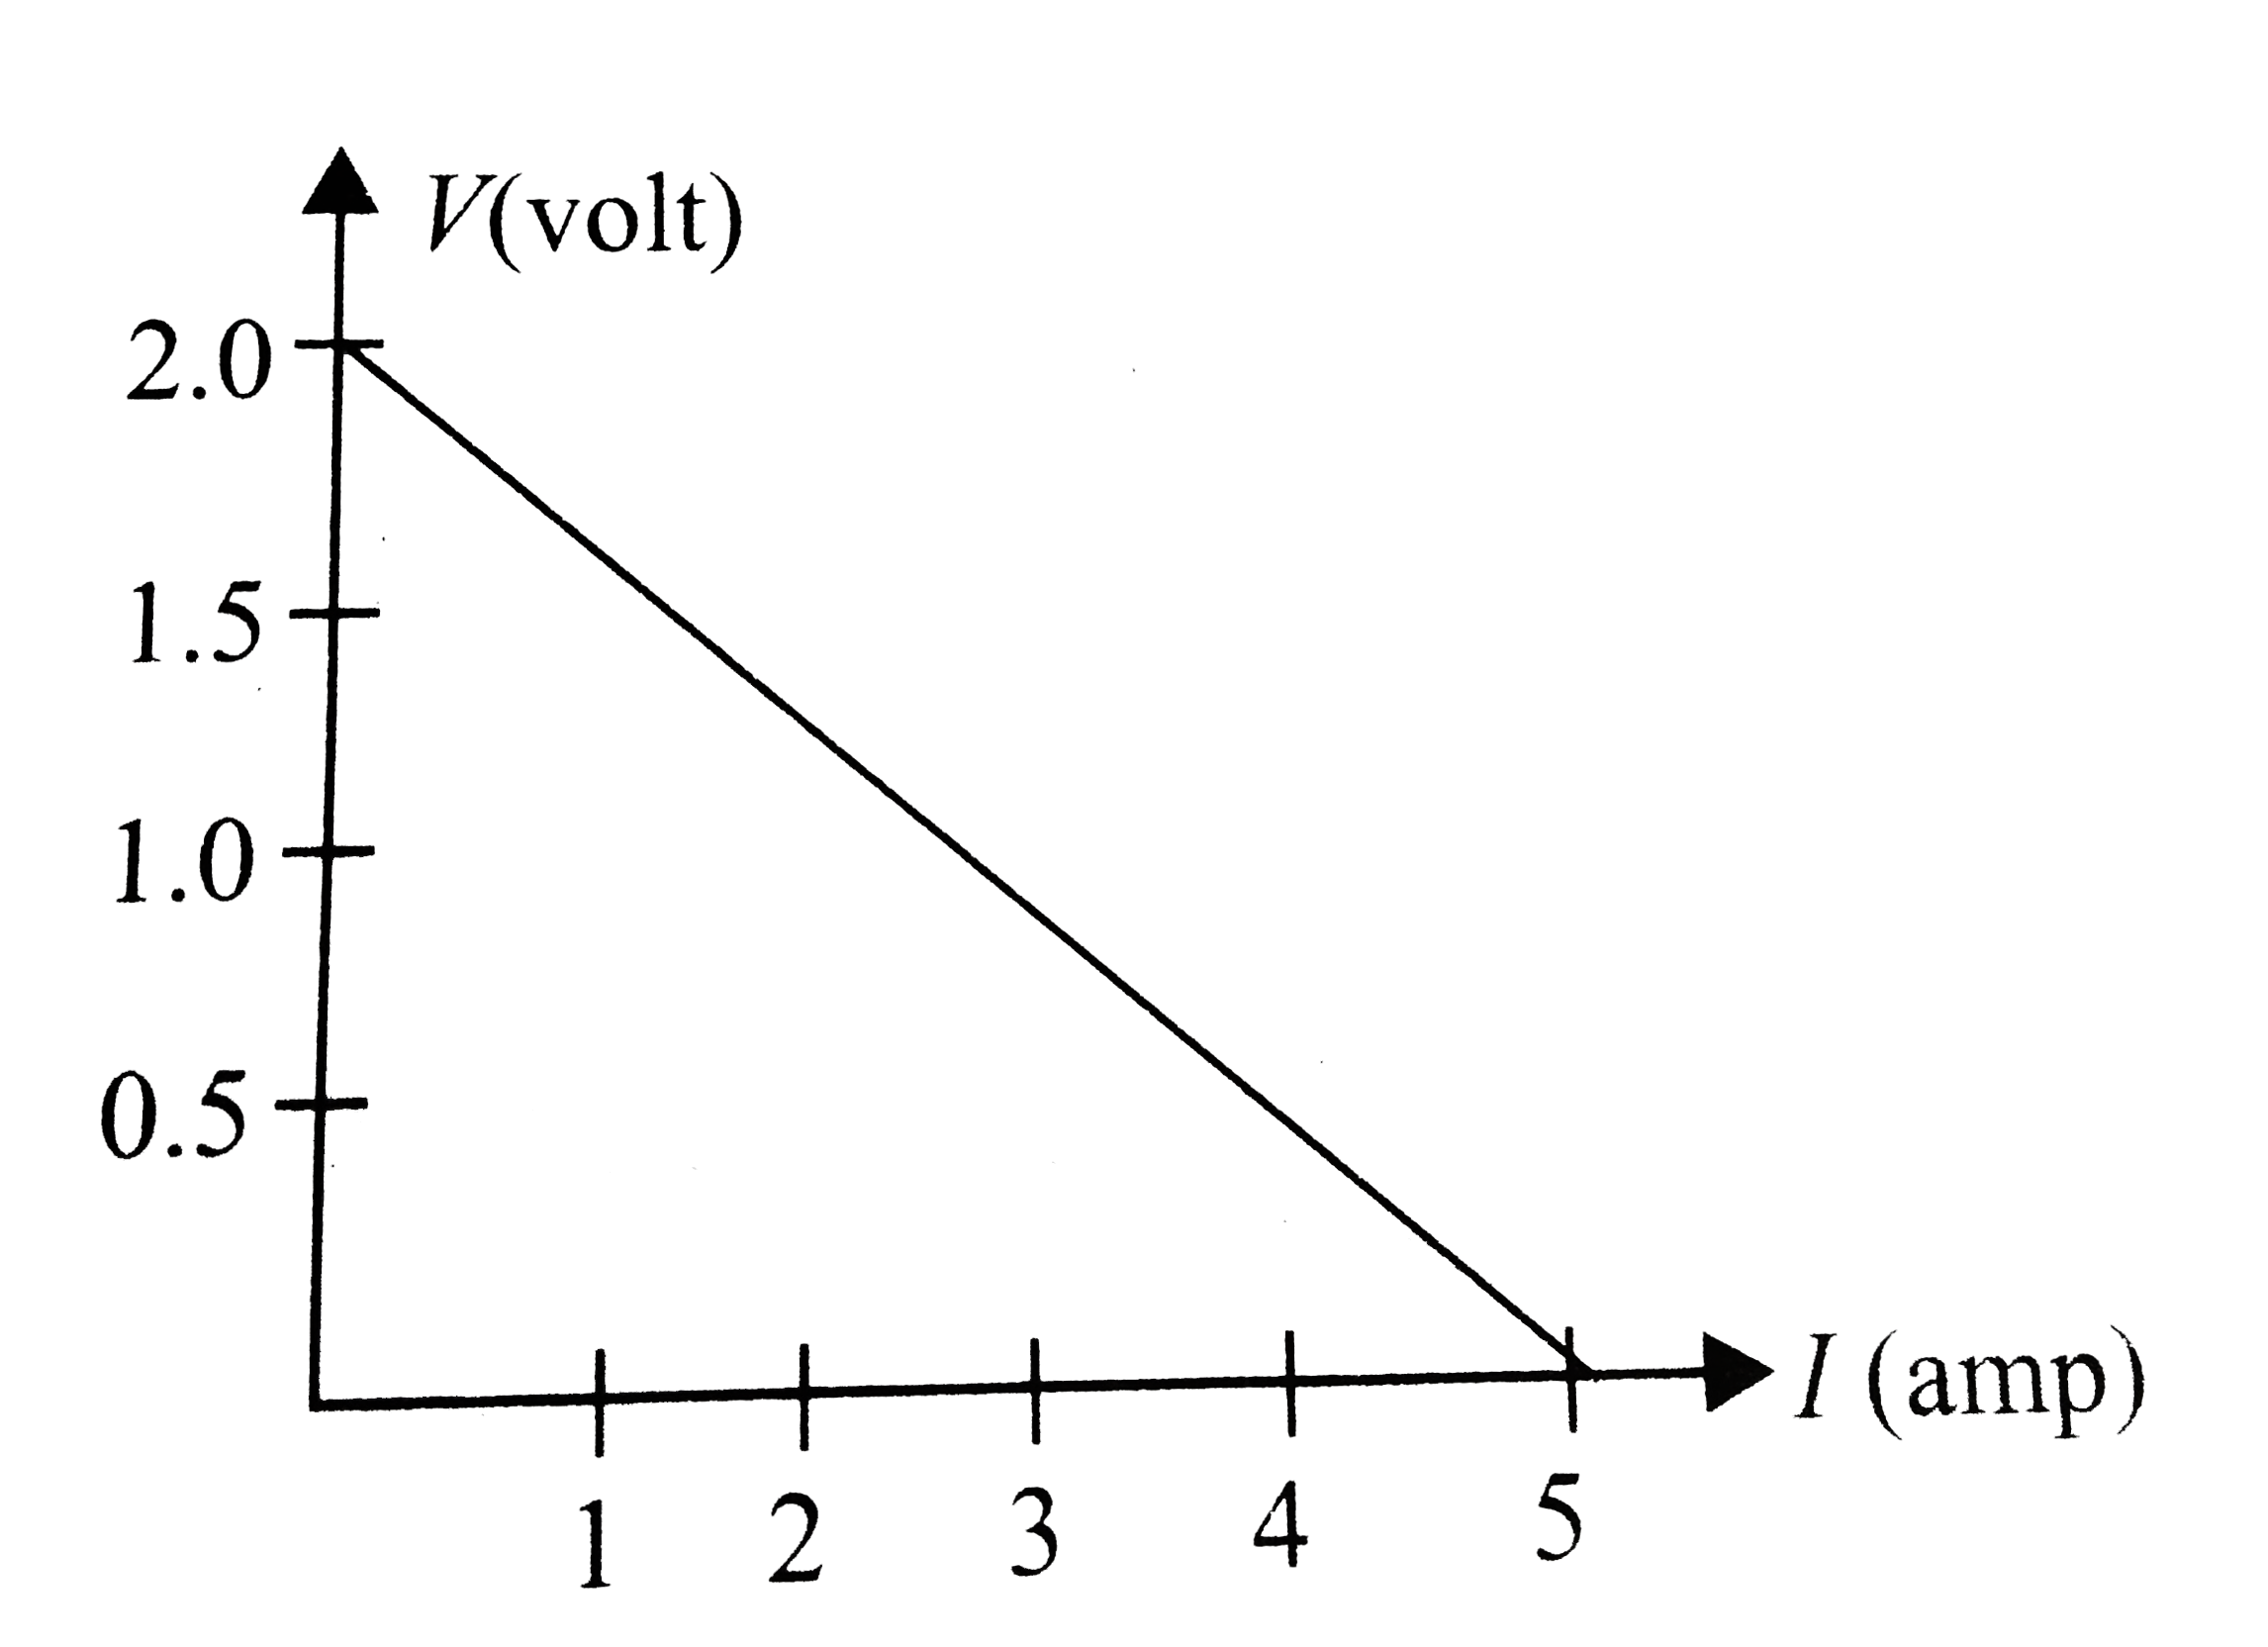
For a cell, a graph is plotted between the potential difference V across the terminals of the cell and the current I drawn the cell. The emf and the internal resistance of the cell are E and r, respectively. Then
 View Solution
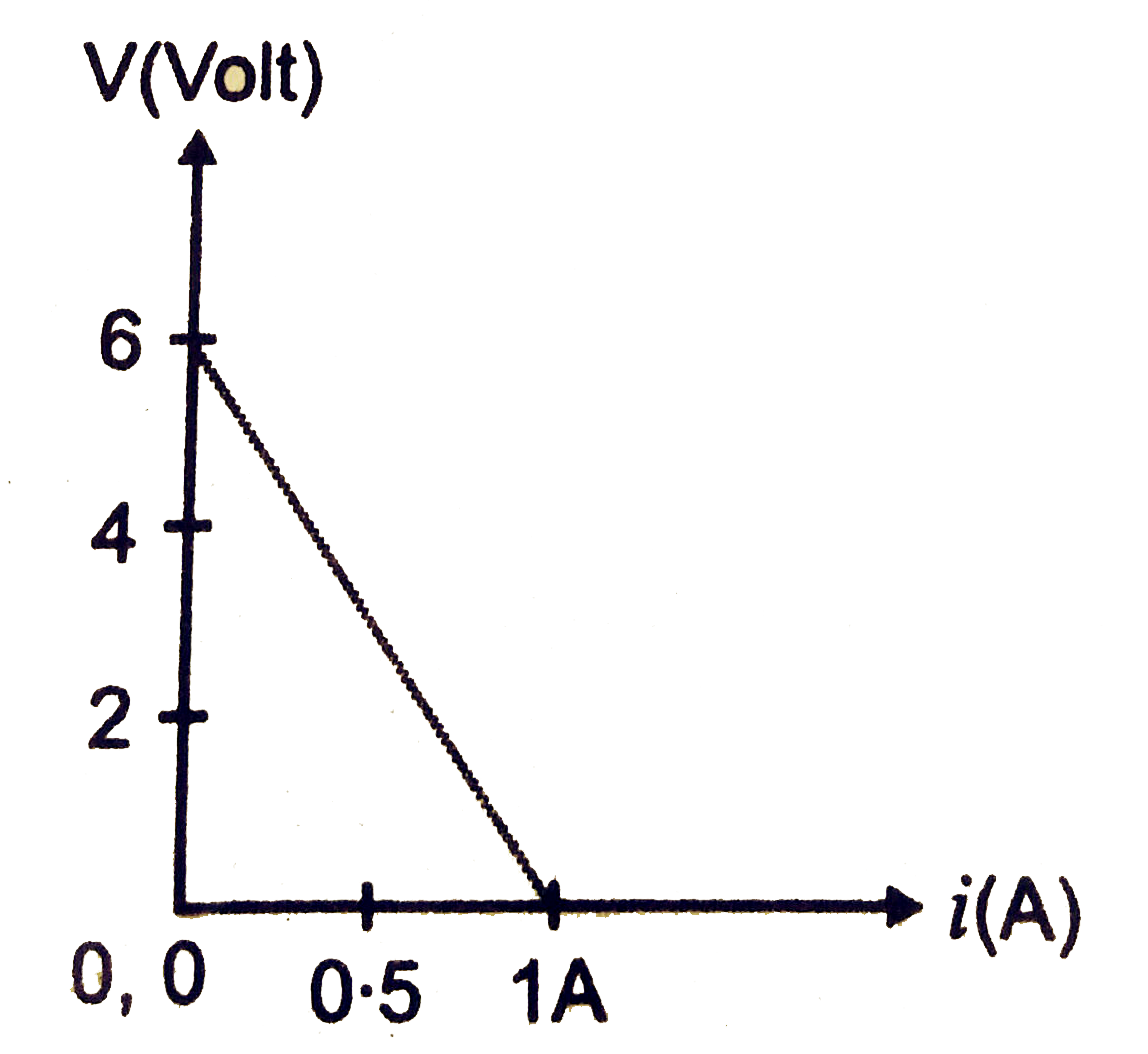
The plot of the variation of potential difference across a combination of three identical cells in series, versus current is as shown in figure. What is the emf and internal resistance of each cell?
 View Solution
The plot of the variation of potential difference across a combination of three identical cells in series, versus current is as shown in figure. What is the emf and internal resistance of each cell?
 View Solution
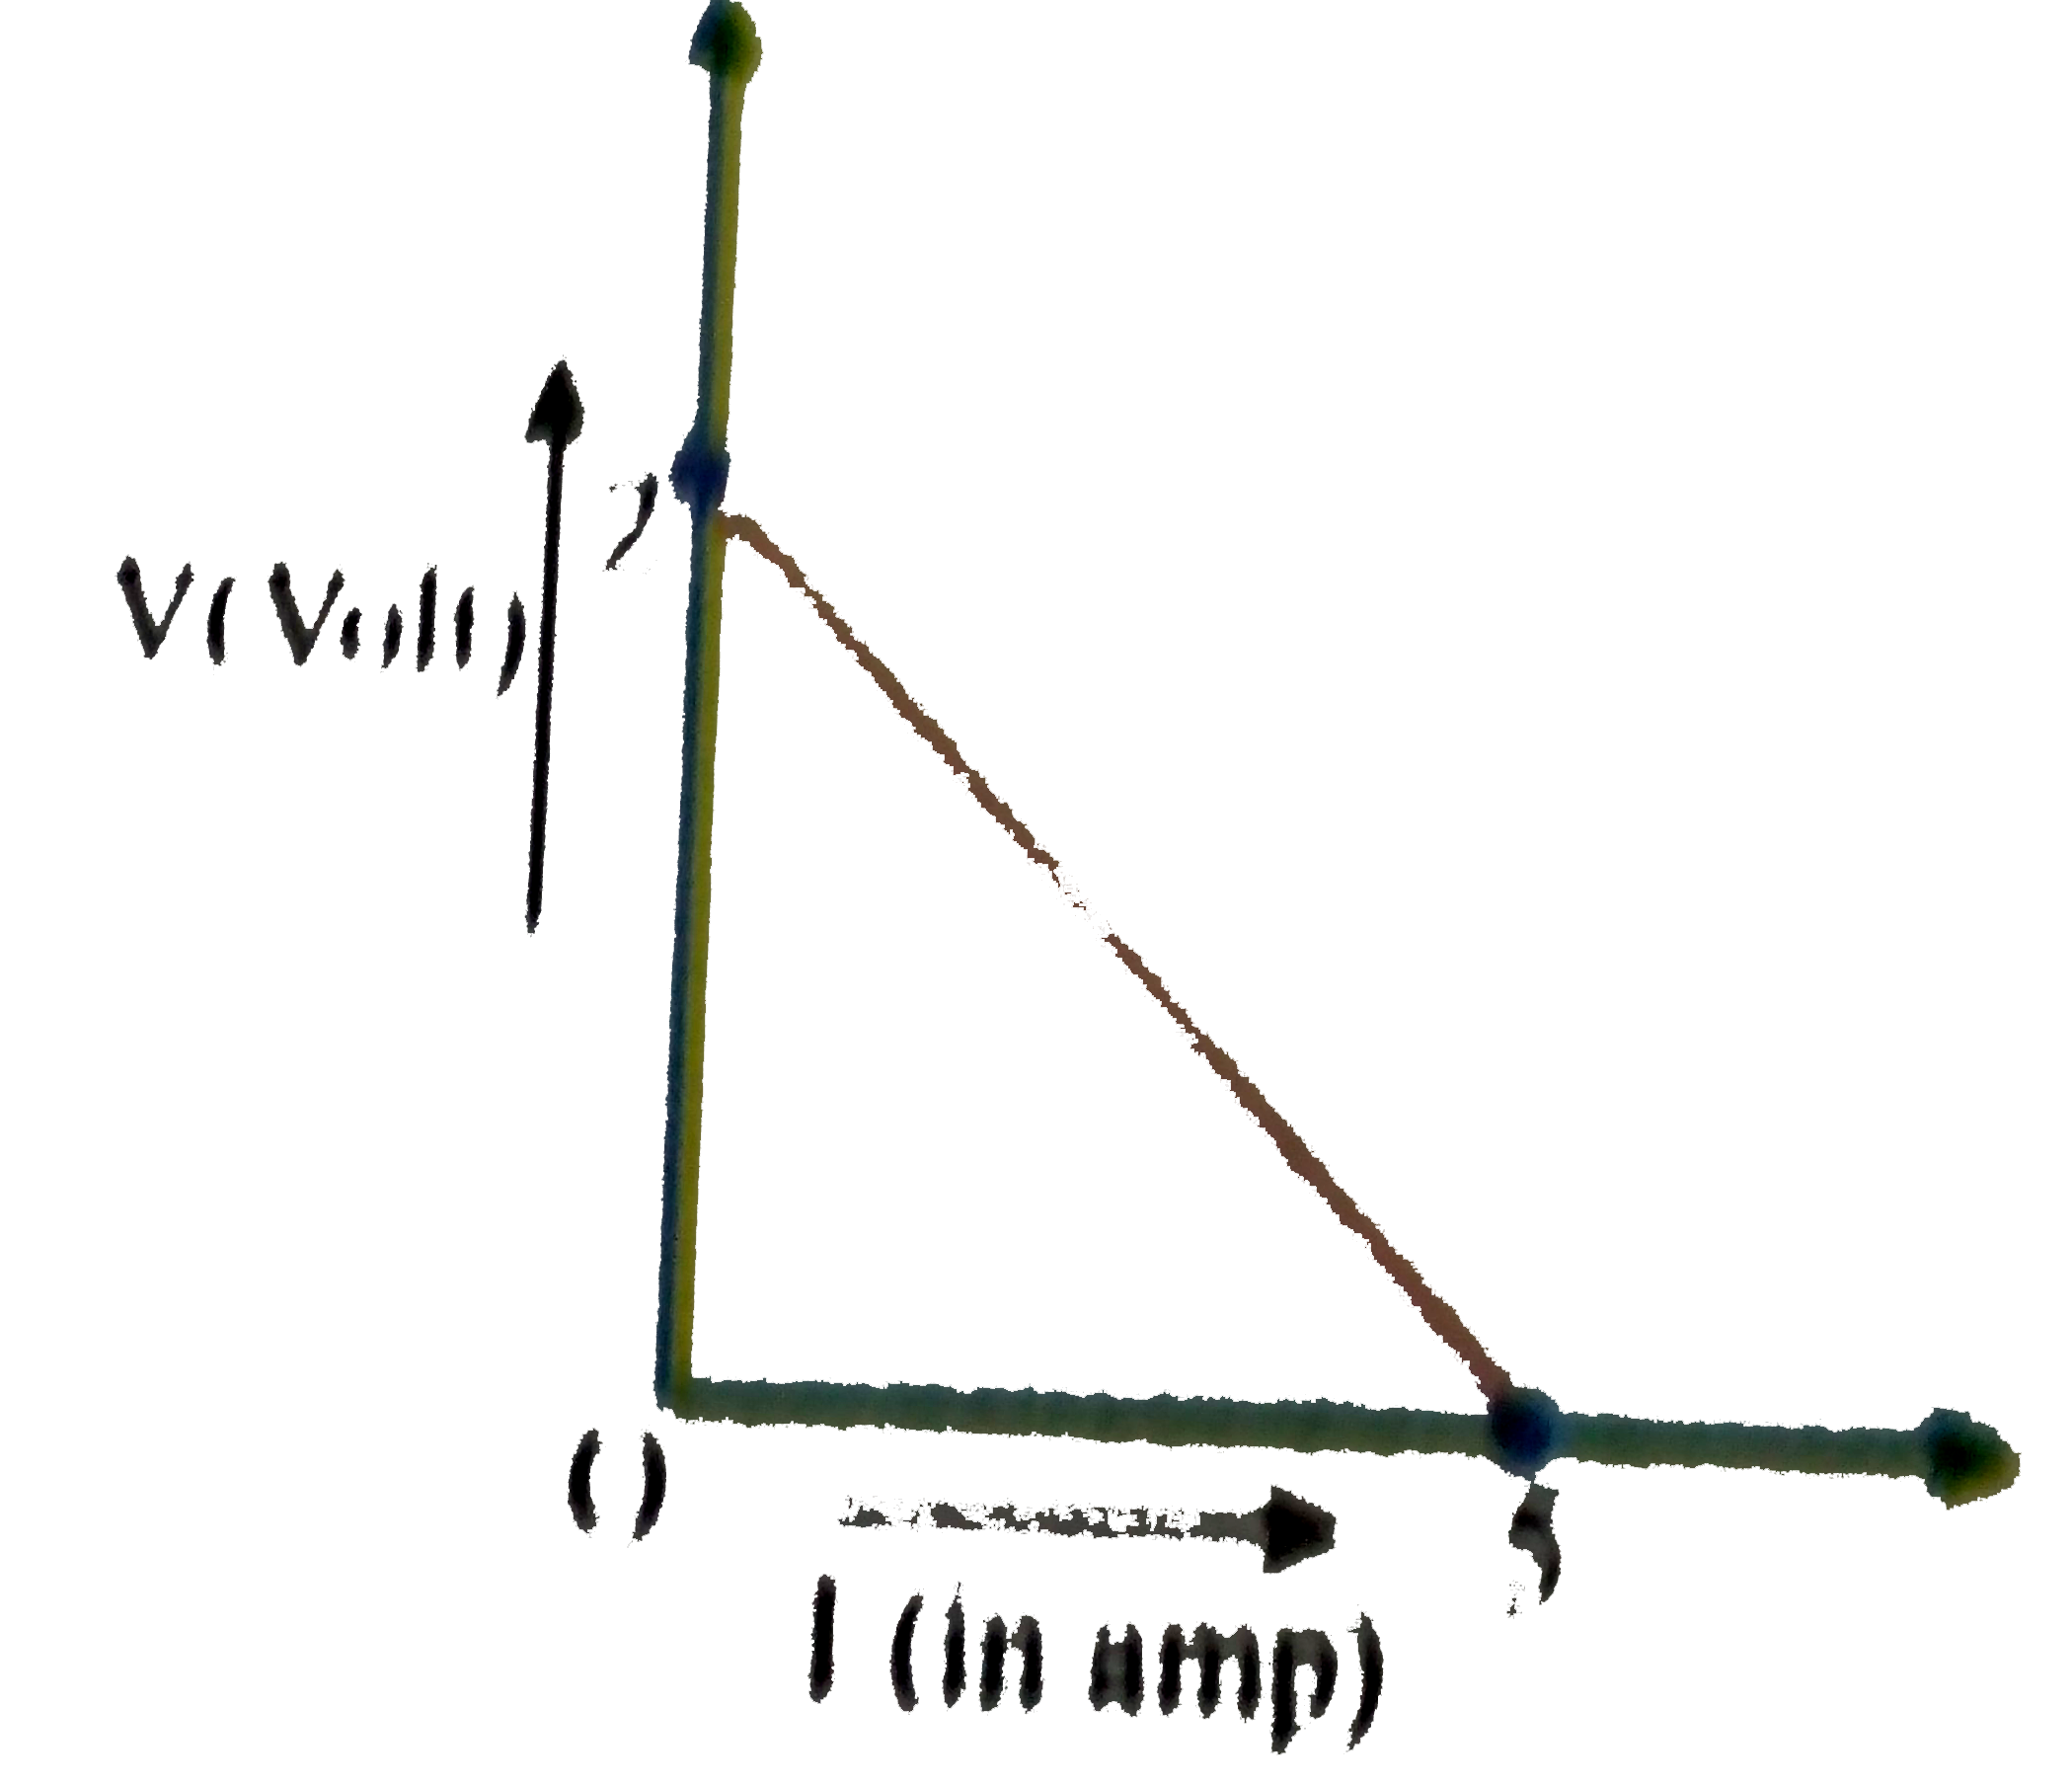
for a cell, the graph between the p.d. (V) across the terminals of the cell ad te current I drawn from the cell is shown in the fig. the emf and the internal resistance of the cell is E and r respectively.
 View Solution
For a cell, a graph is plotted between the potential difference V across the terminals of the cell and the current I drawn the cell. The emf and the internal resistance of the cell are E and r, respectively. Then
 View Solution

