The given graph show how the amount of carbon dioxide taken in by a plant varies though a 24 hours period.
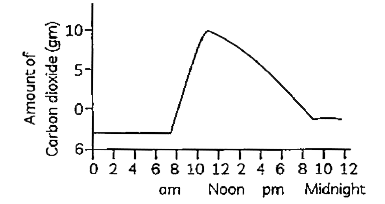
At what time the rate of photosynthesis is greatest ?
4±
10am
6cm
12±
The correct Answer is:D
The rate of photosynthesis is greatest at 12 noon as the amount of CO2 taken in was greatest at that time.
Similar Questions
Knowledge Check
The given line graph shows the growth rate of a kitten . During which 2 - month period, the kitten's weight increased the most
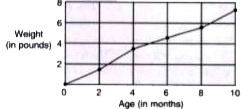 A0 to 2 monthsB2 to 4 monthsC4 to 6 monthsD6 to 8 months
The amount of biomass or organic matter produced per unit area over a time period by the plants during photosynthesis is called
APrimary productivityBSecondary productivityCStanding stateDStanding cropThe graph shows how the count-rate A of a radioactive source varies with time t. A and t are related as: (assume in (12)=2.5)
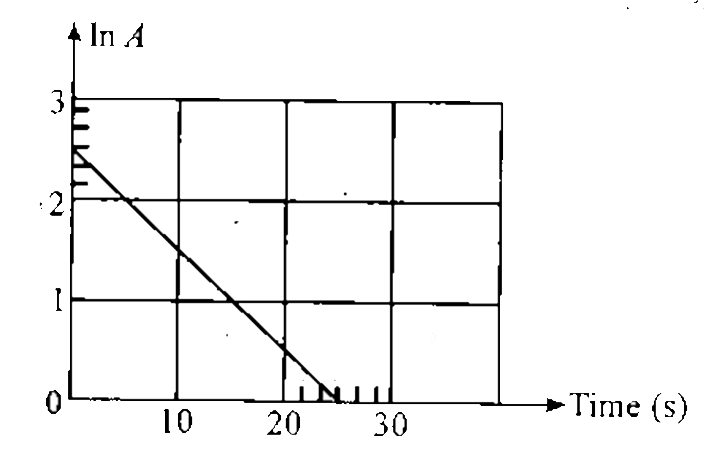 AA=2.5e−10tBA=12e10tCA=2.5e−(0.1t)DA=12e−(0.1t)
The amount of biomass or organic matter produced per unit area over a time period by the plants during photosynthesis is called
View Solution(a) What would happen if all the green plants disappear from the earth ?
(b) If a plant is releasing carbon dioxide and taking in oxygen during the day, does it mean that there is no photosynthesis occurring ? Justify your answer.
View Solution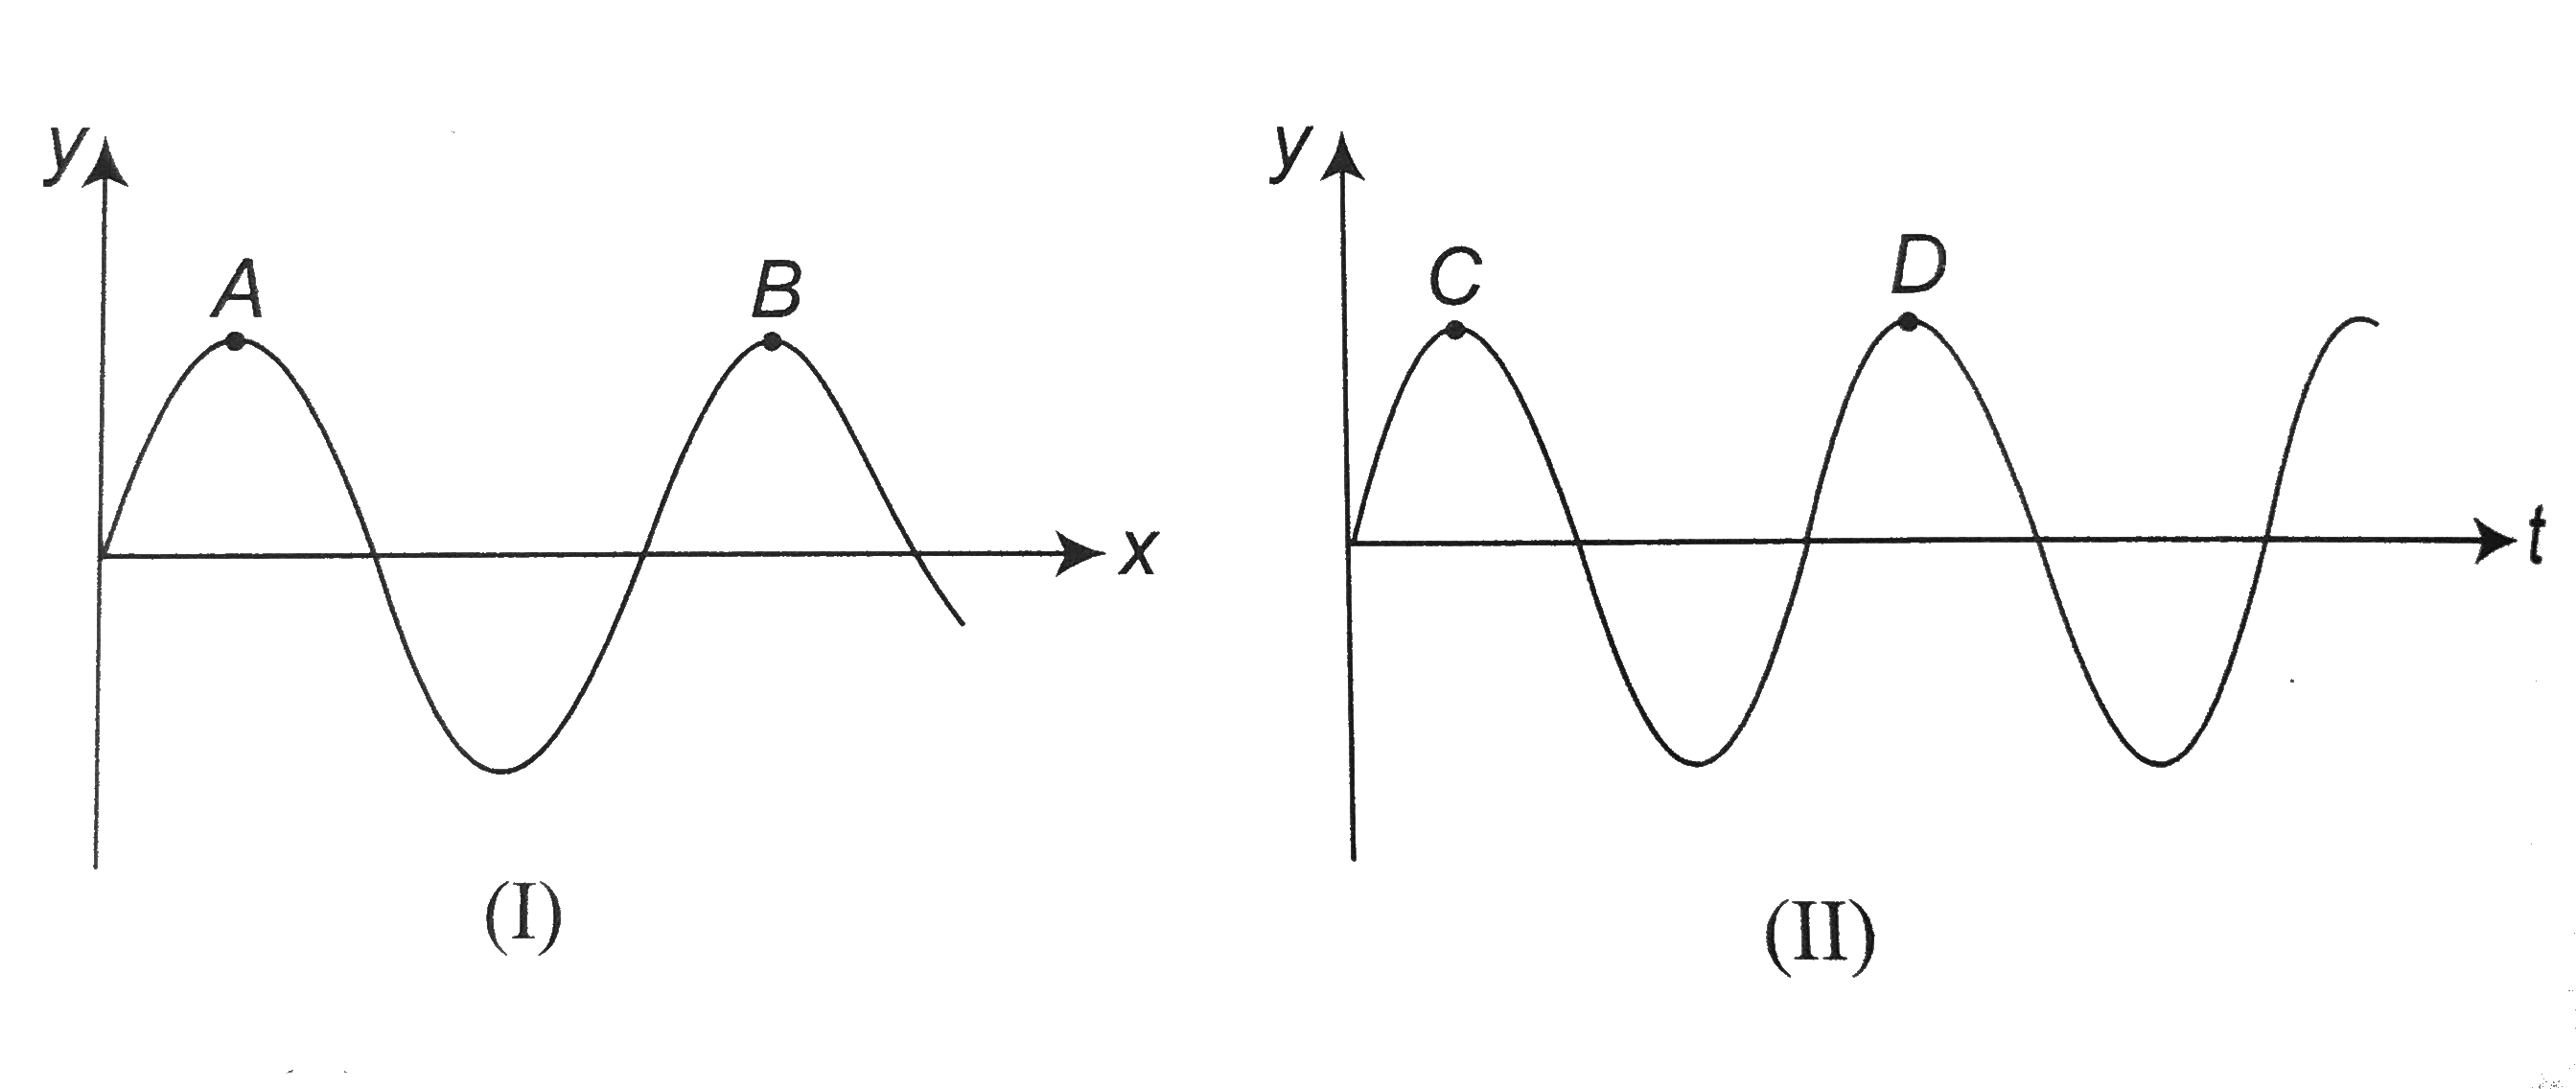
The same progressive wave is represented by two graphs I and II. Graph I shows how the displacement y varies with the distance x along the wave at a given time. Graph II shows how y varies with time t at a given point on the wave. The ratio of measurements AB to CD, marked on the curves represents:
View SolutionA potted plant with variegated leaves was taken in order to prove a factor necessary for photosynthesis. The potted plant was kept in the dark for 24 hours and then placed in bright sunlight for a few hours Observe the diagrams and answer the questions.
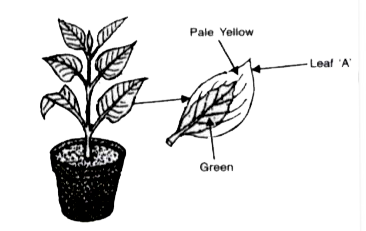
What aspect of photosynthesis is being tested in the above diagram?
View Solution
The same progressive wave is represented by two graphs I and II. Graph I shows how the displacement y varies with the distance x along the wave at a given time. Graph II shows how y varies with time t at a given point on the wave. The ratio of measurements AB to CD, marked on the curves represents:
View Solution
