A student performed the following activity to find the electrical conductivity of some substances by dissociating into ions. He took samples of diLHCl, glucose, dit.NaOH and alcohol one by one and completed the circuit as shown below:
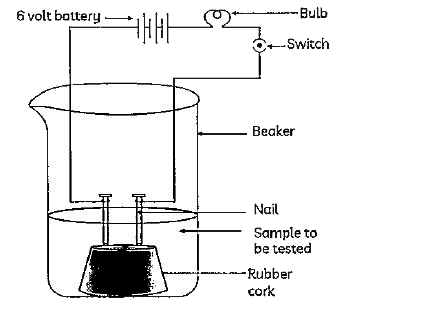
Which of the samples will conduct electricity?
(I) DIL HCL (II) Dil. NaOH
(III) Glucose (IV) Alcohol
Only (I)
Only (II)
Both (I) and (II)
(I), (II) and (IV)
The correct Answer is:C
The bulb glows when electrolyte is an acid or a base as in both cases ions are produced in aqueous solution due to which current flows through the solution. Therefore, correct answer is dit.HCl and dit.NaOH
Topper's Solved these Questions
Similar Questions
An experiment was performed to test the electrical conductivity of some substances as shown in figure below:
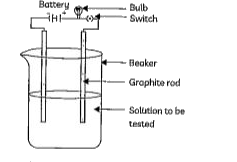
The soluton of which of the following will not conduct electricity?
View SolutionWhich of the following solutions are electrolytes?
i. Dil. HCl
ii. Sugar Solution
iii. Alcohol in water
iv. Lime water
View Solution
Knowledge Check
Rohit has performed an activity to test whether the following materials conduct electricity or not by putting them in the circuit, one at a time as shown in the figure.
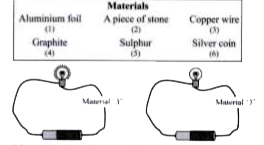
Materials X and Y could beAX-1,3,4,6, Y-2,5BX-1,5,6, Y-2,3,4CX-1,3,6, Y-2,4,5DX-2,3,4,5, Y-1,6Which of the following is/are correct for absorption from the stomach?
I. The substance nrmally absorbed from the stomach are some water, glucose and considerable amount of alcohol.
II. The substances are absorbed through the walls of the stomach into the venous circulation.
III. There is no absorption but a few drugs may be absorbed
IV. Some amountof vitamins and absorbed.AOnly IBI and IICIII and IVDOnly IV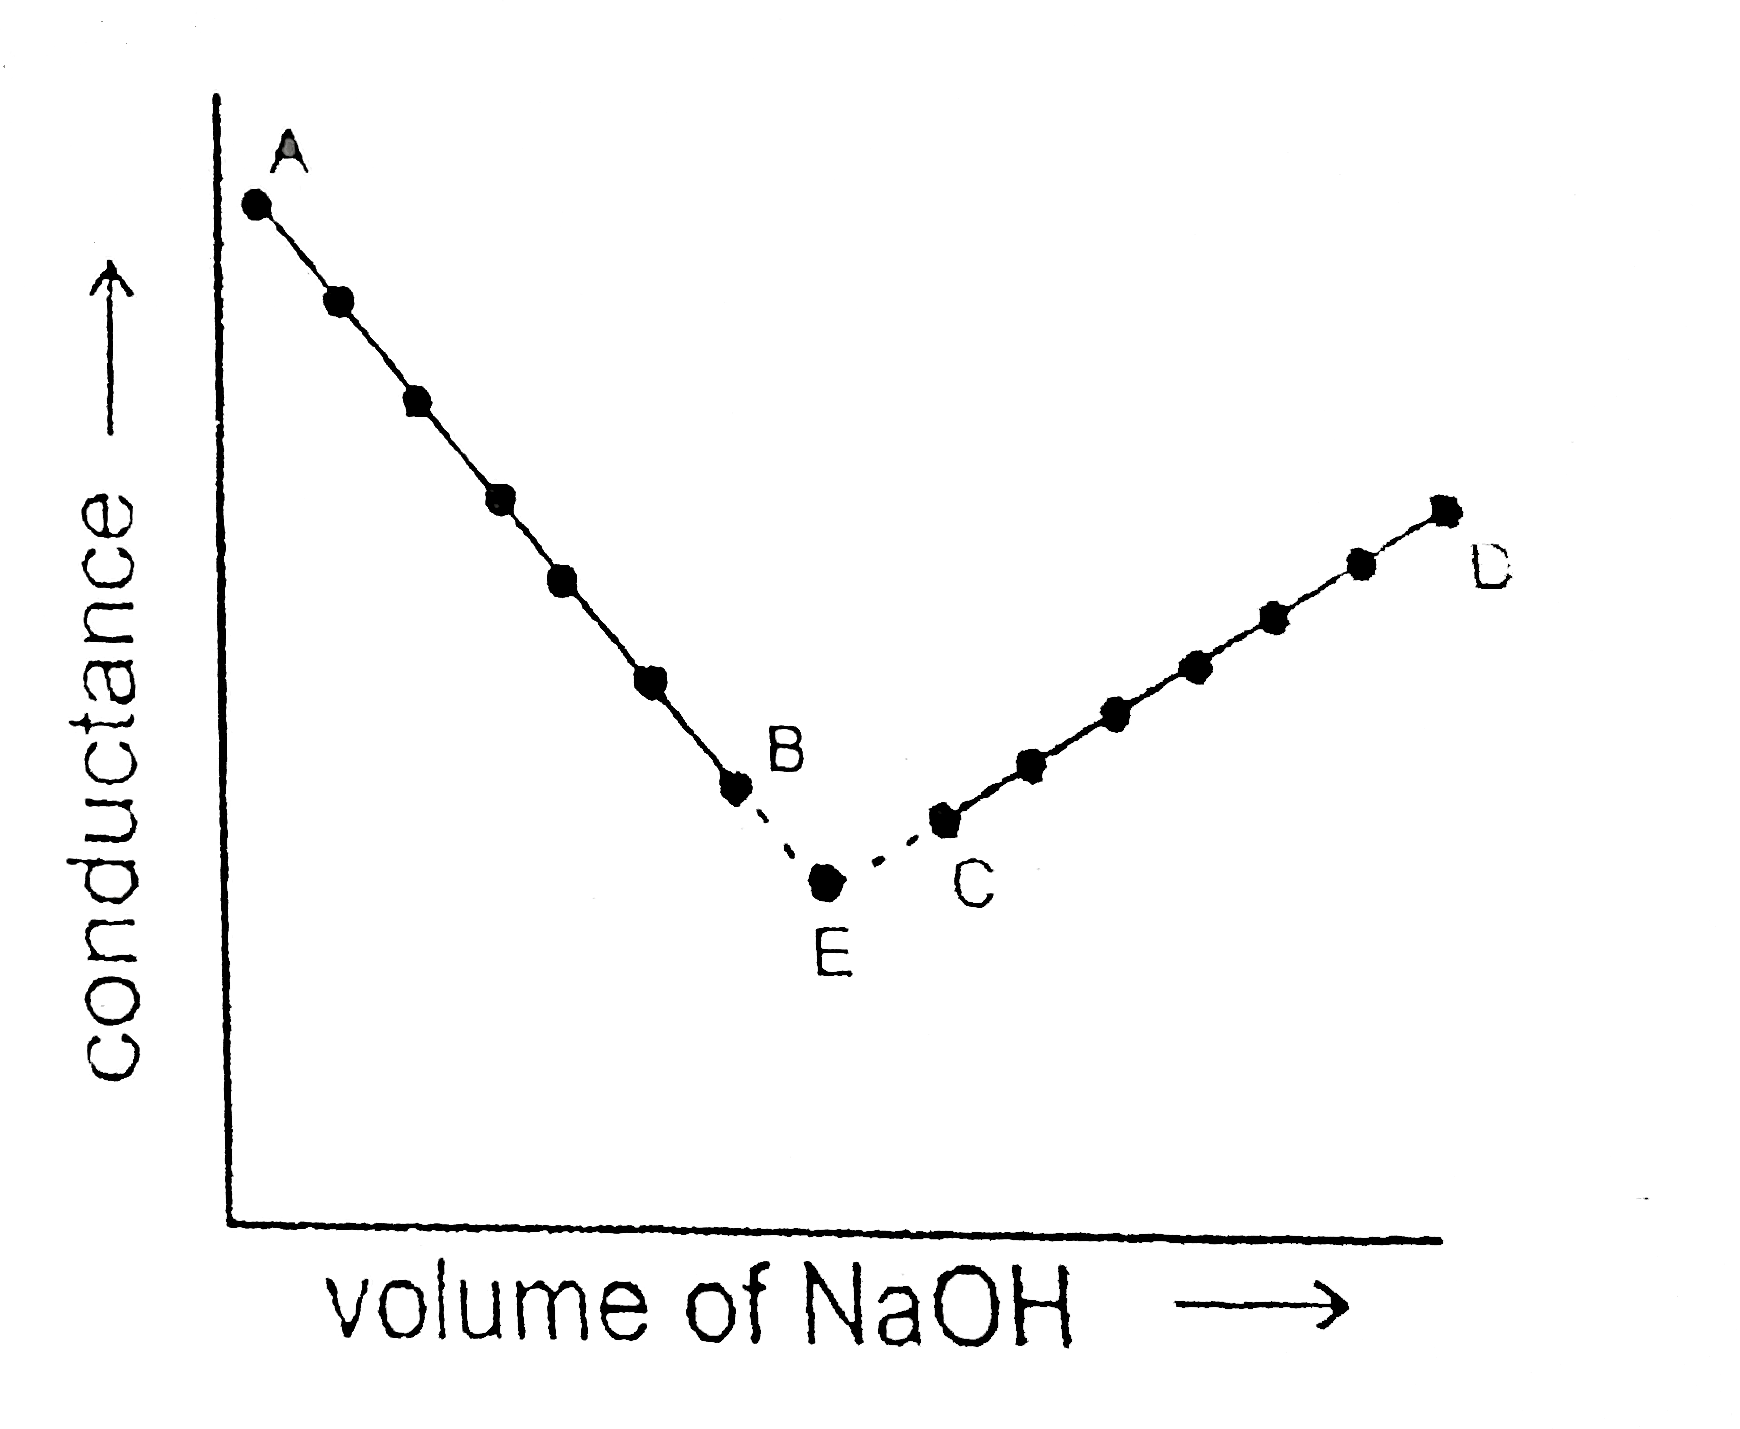
Strong acid versus strong base:
The principle of conductometric titrations is based on the fact that during the titration, one of the ions is replaced by the other and invariable these two ions differ in the ionic conductivity with the result that thhe conductivity of the solution varies during the course of the titration. take, for example, the titration between a strong acid, say HCl, and a string base, say NaOH before NaOH is added, the conductance of HCl solution has a high value due to the presence of highly mobile hydrogen ions. As NaOH is added, H+ ions are replaced by relatively slower moving Na+ ions. consequently the conductance of the solution decreases and this continues right upto the equivalence point where the solution contains only NaCl. Beyond the equivalence point, if more of NaOH is added, then the solution contains a excess of the fast moving OH− ions with the result that its conductance is increased ad it condinues to increase as more and more of NaOH is added. If we plot the conductance value versus the amount of NaOH added, we get a curve of the type shown in Fig. The descending portion AB represents the conductances before the equivalence point (solution contains a mixture of acid HCl and the salt NaCl) and the ascending portion CD represents the conductances after the equivalence point (solution contains the salt NaCl and the excess of NaOH). The point E which represent the minium conductance is due to the solution containing only NaCl with no free acid or alkali and thus represents the equivalence point. this point can, however, be obtained by the extrapolation of the lines AB and DC, and therefore, one is not very particular in locating this point expermentally as it is in the case of ordinary acid-base titrations involving the acid-base indicators.
Weak acid versus strong base:
Let us take specific example of acetic acid being titrated against NaOH. Before the addition of alkali, the solution shows poor conductance due to feeble ionization of acetic acid. Initially the addition of alkali causes not only the replacement of H+ by Na+ but also suppresses the dissociation of acetic acid due to the common ion Ac− and thus the conductance of the solution decreases in the beginning. but very soon the conductance start increasing as addition of NaOH neutralizes the undissociated HAc to Na+Ac− thus causing the replacement of non-conducting HAc with Strong-conducting electrolyte Na+Ac−. the increase in conductance continuous right up to the equivalence point. Beyond this point conductance increases more rapidly with the addition of NaOH due to the highly conducting OH− ions, the graph near the equivalence point is curved due to the hydrolysis of the salt NaAc. The actual equivalence point can, as usual, be obtained by the extrapolation method.
In all these graphs it has been assumed that the volume change due addition of solution from burrette is negnigible, hence volume change of the solution in beaker the conductance of which is measured is almost constant throughout the measurement.
Q. The nature of curve obtained for the titration between weak acid versus strong base as described in the above passage will be:A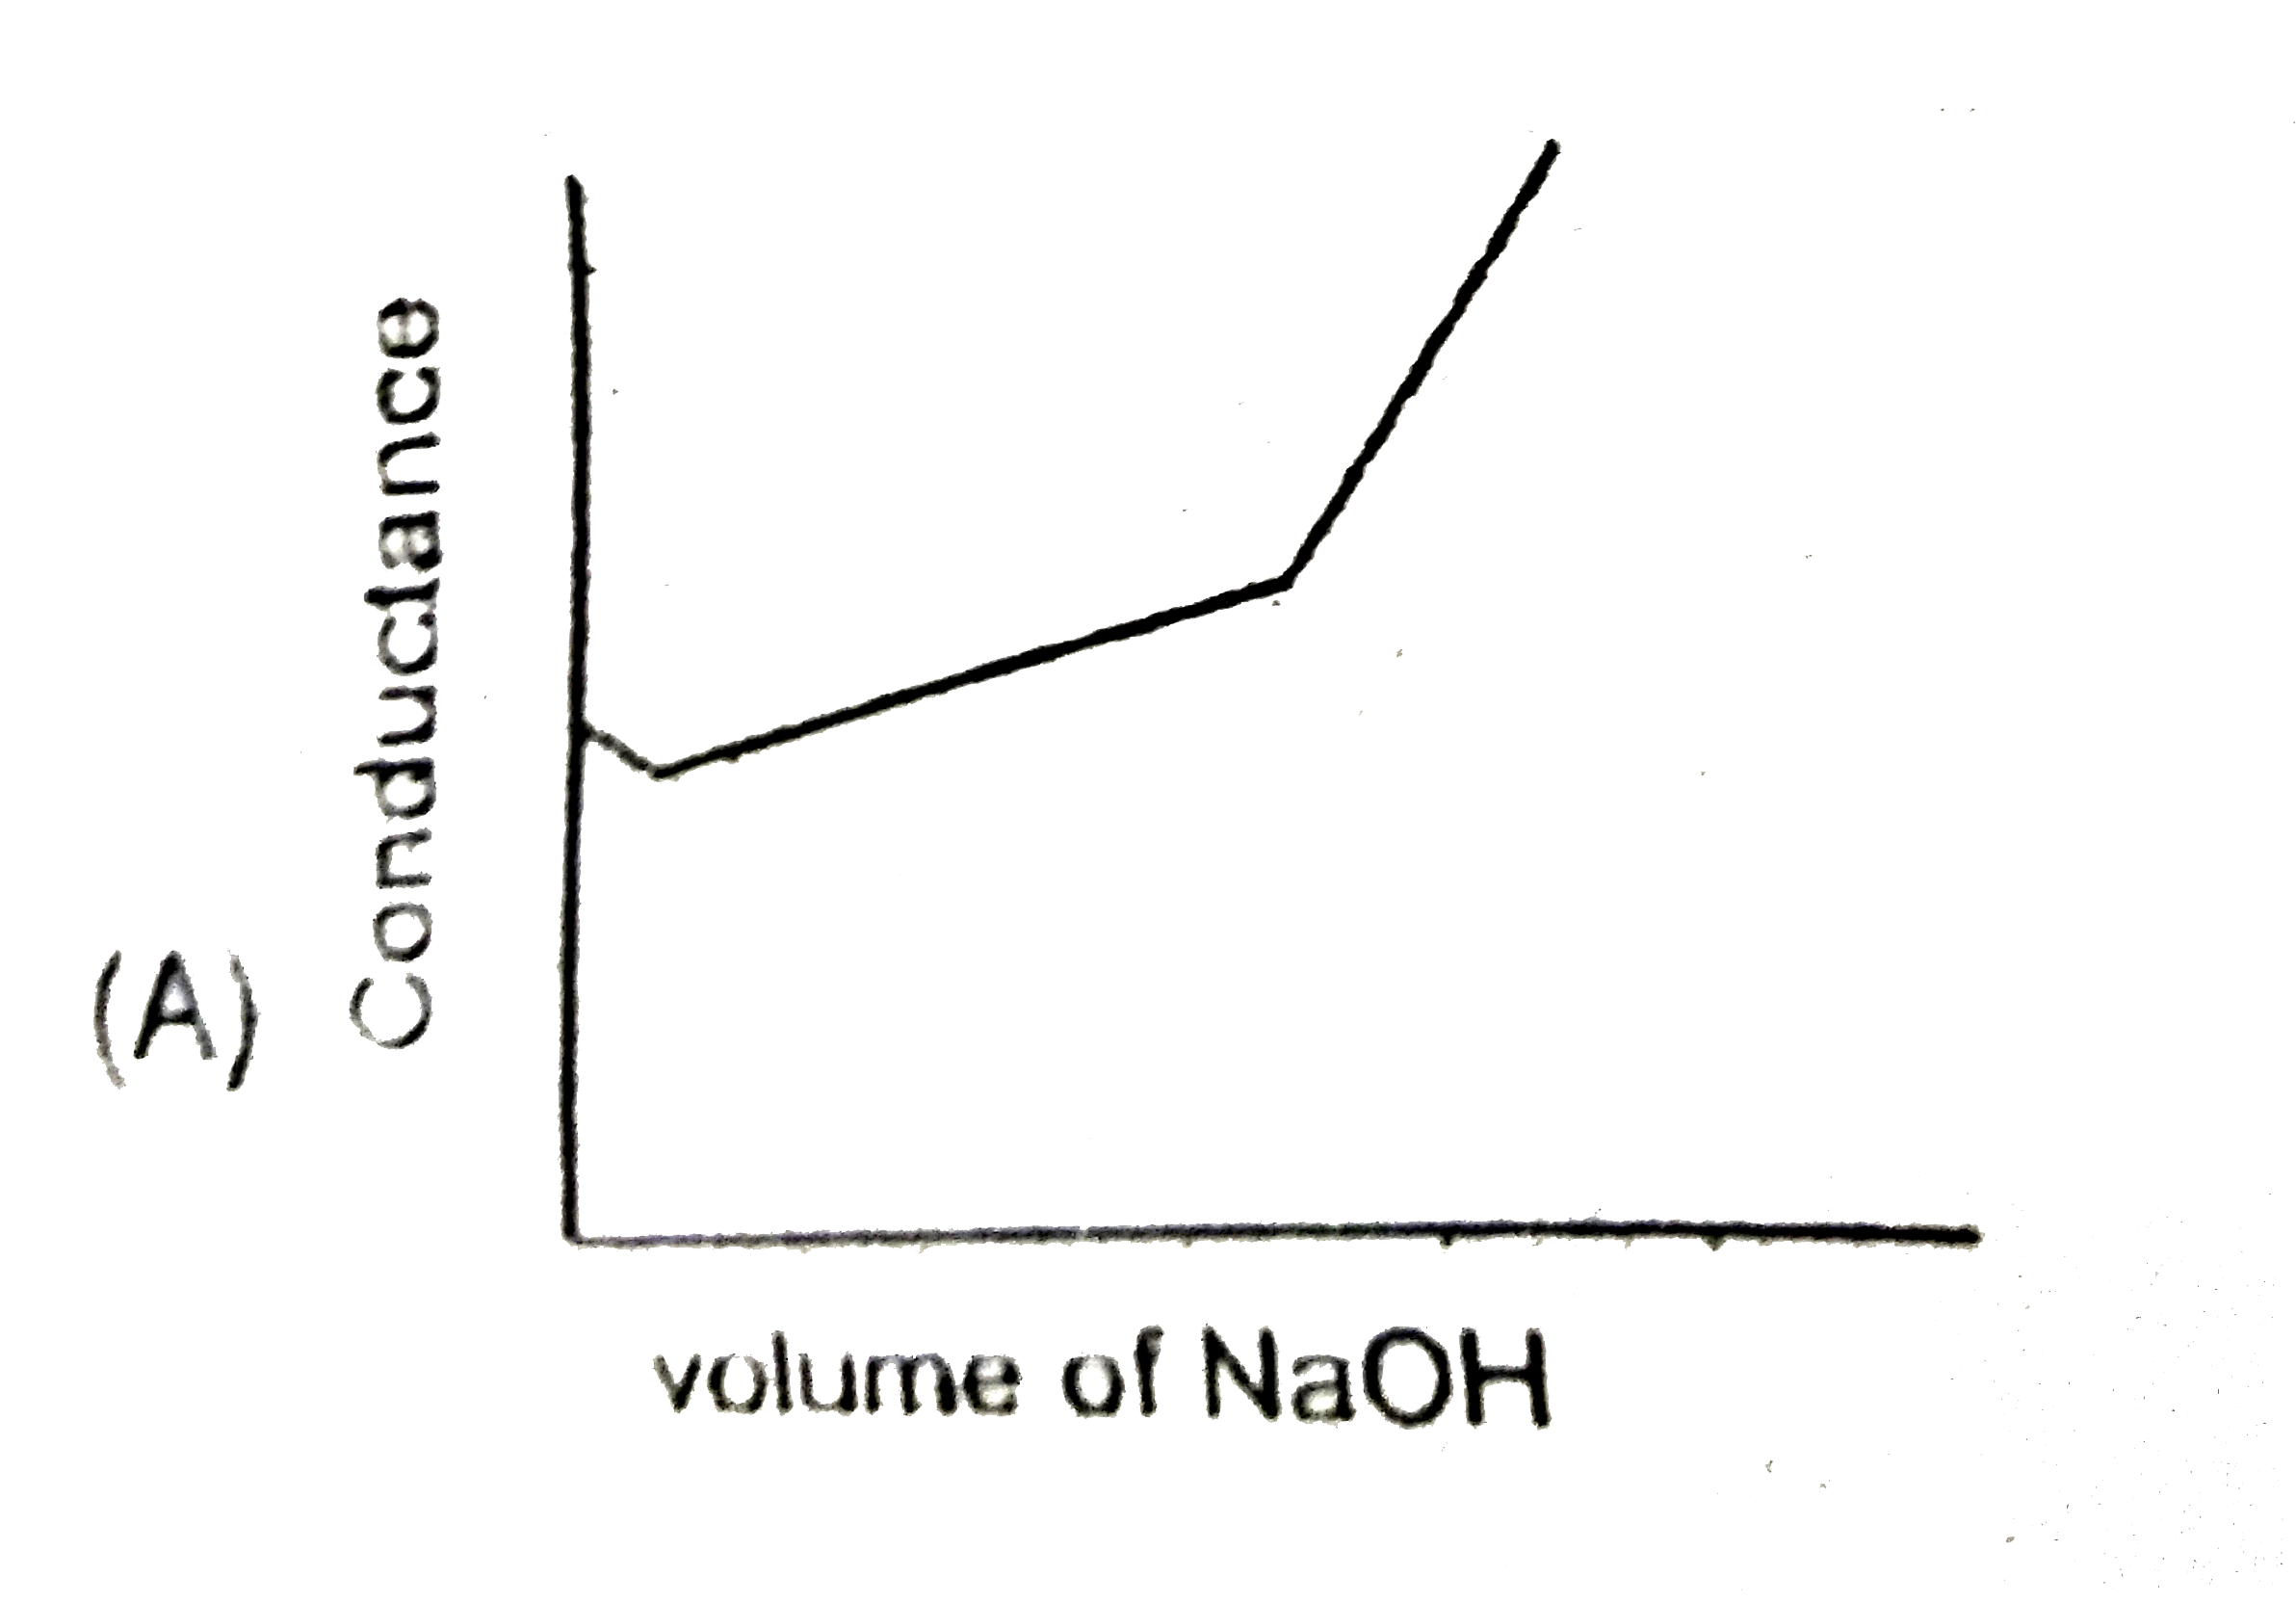 B
B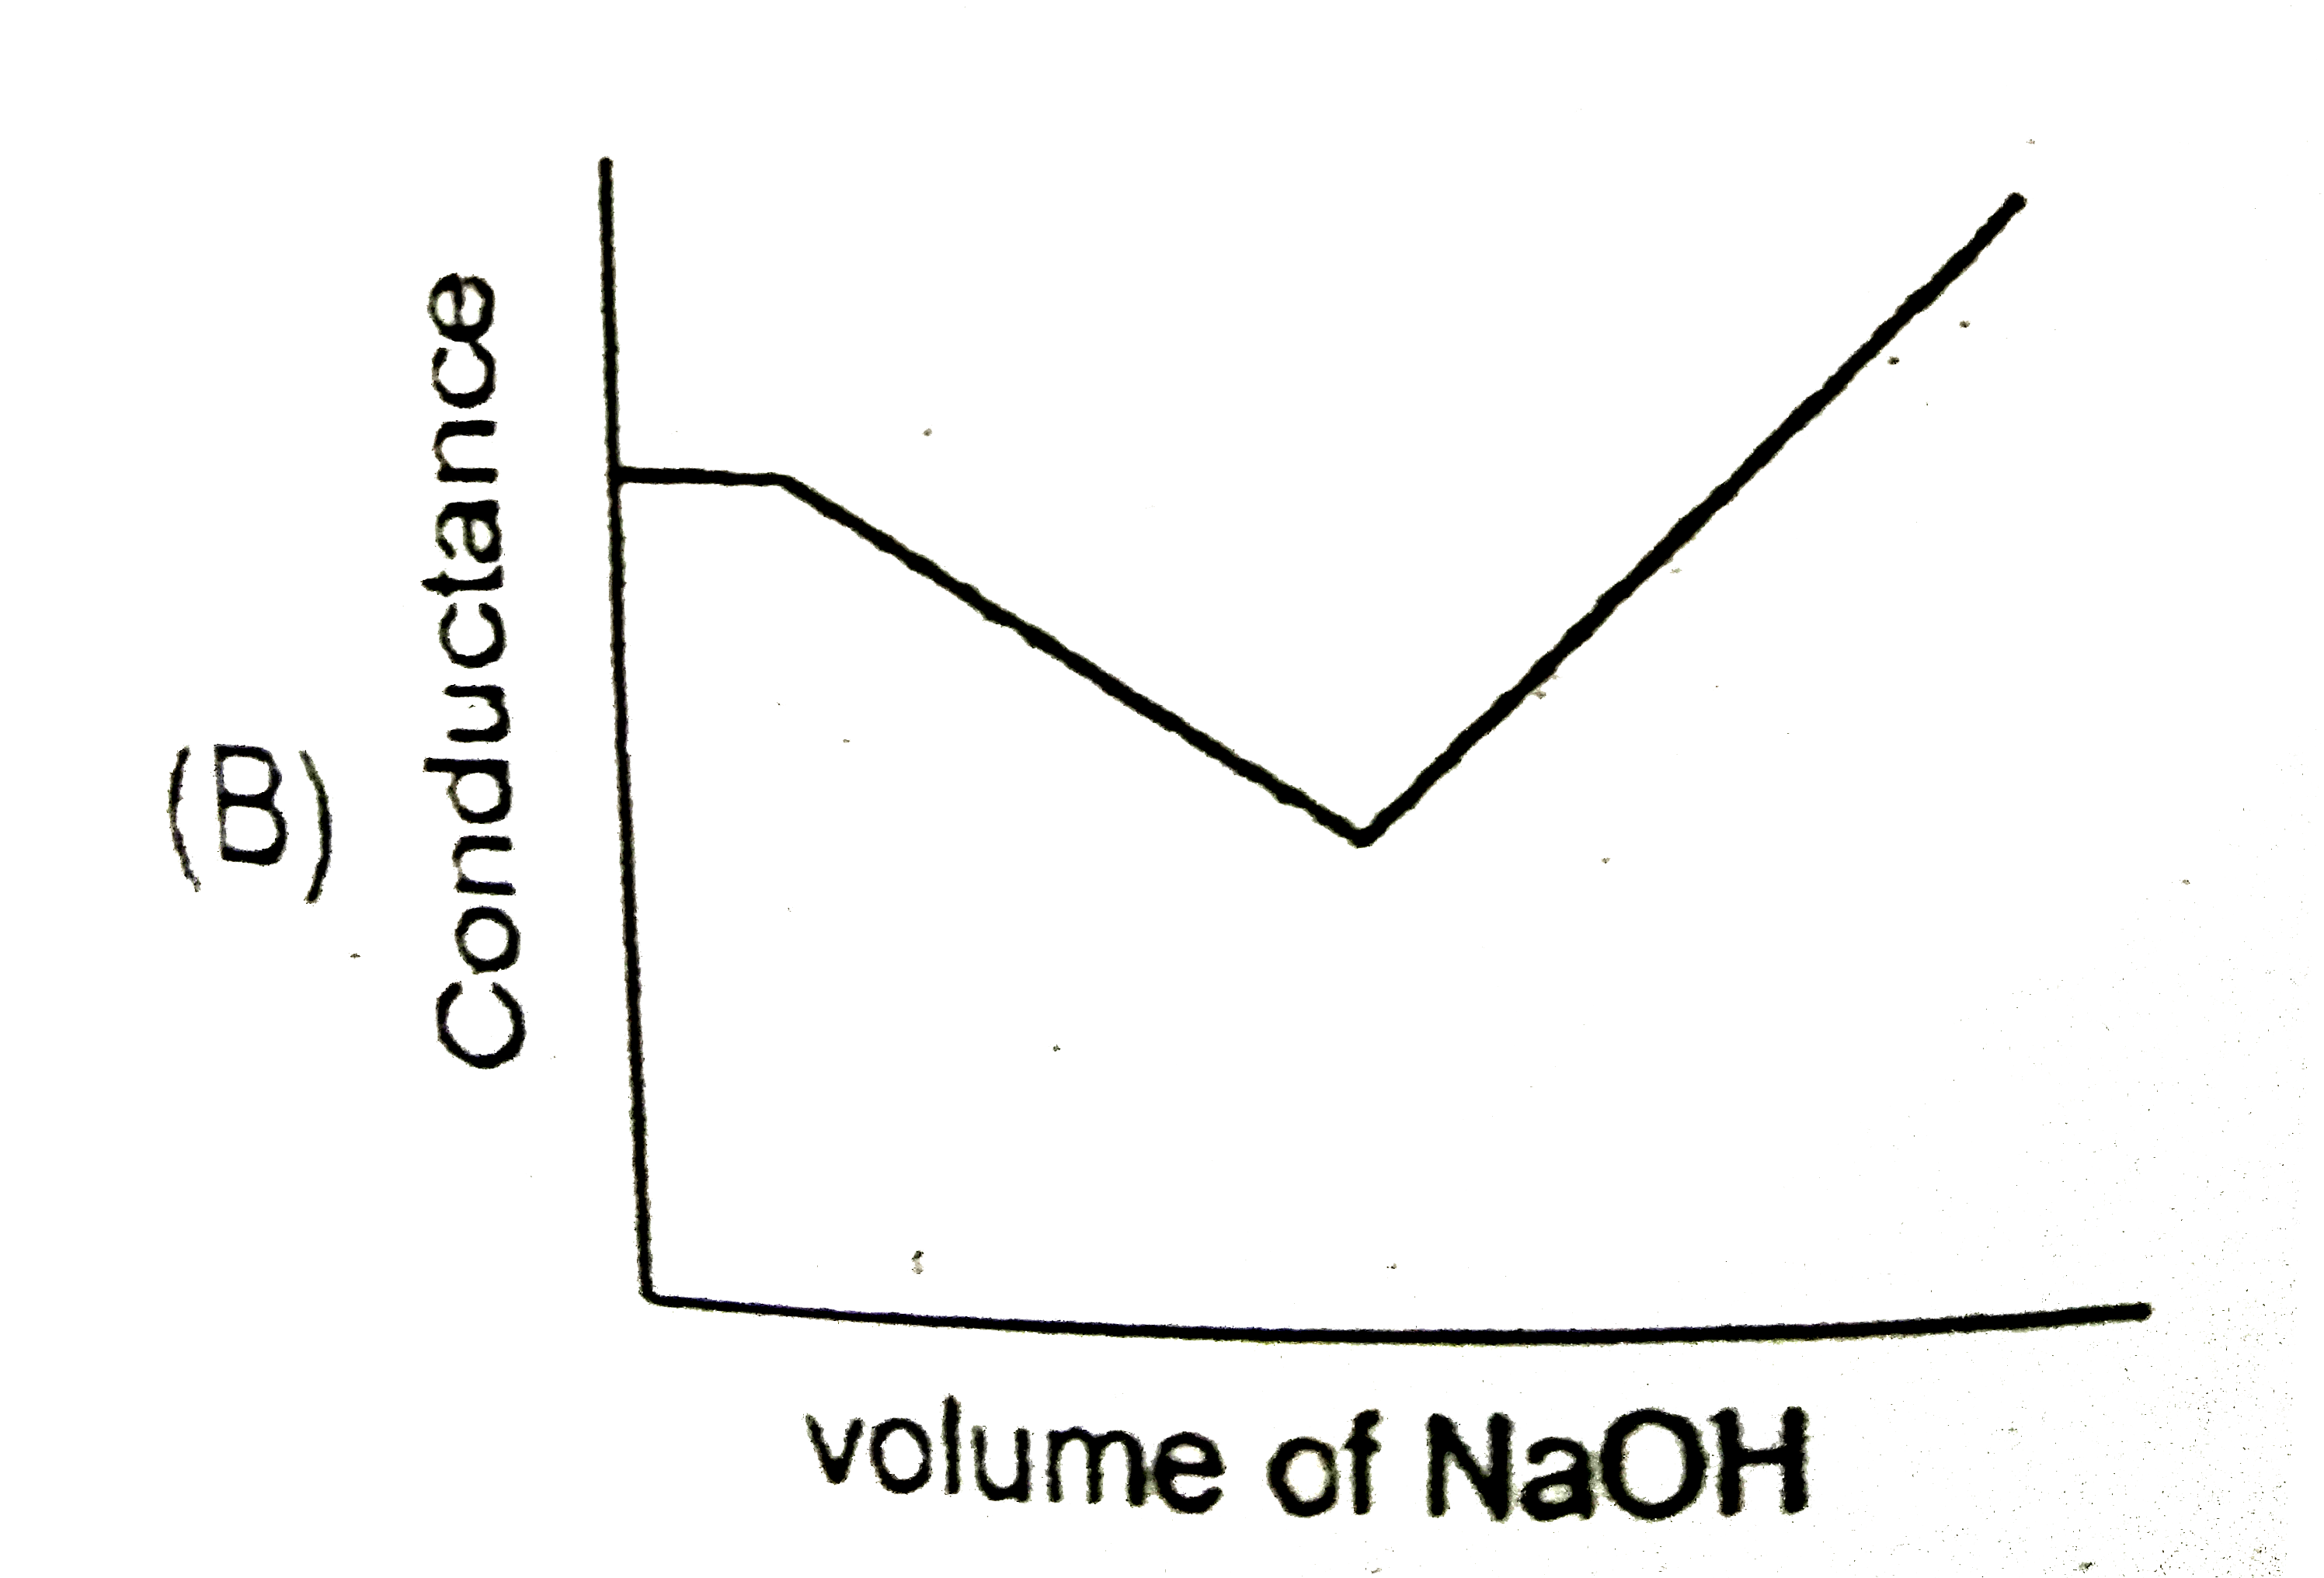 C
C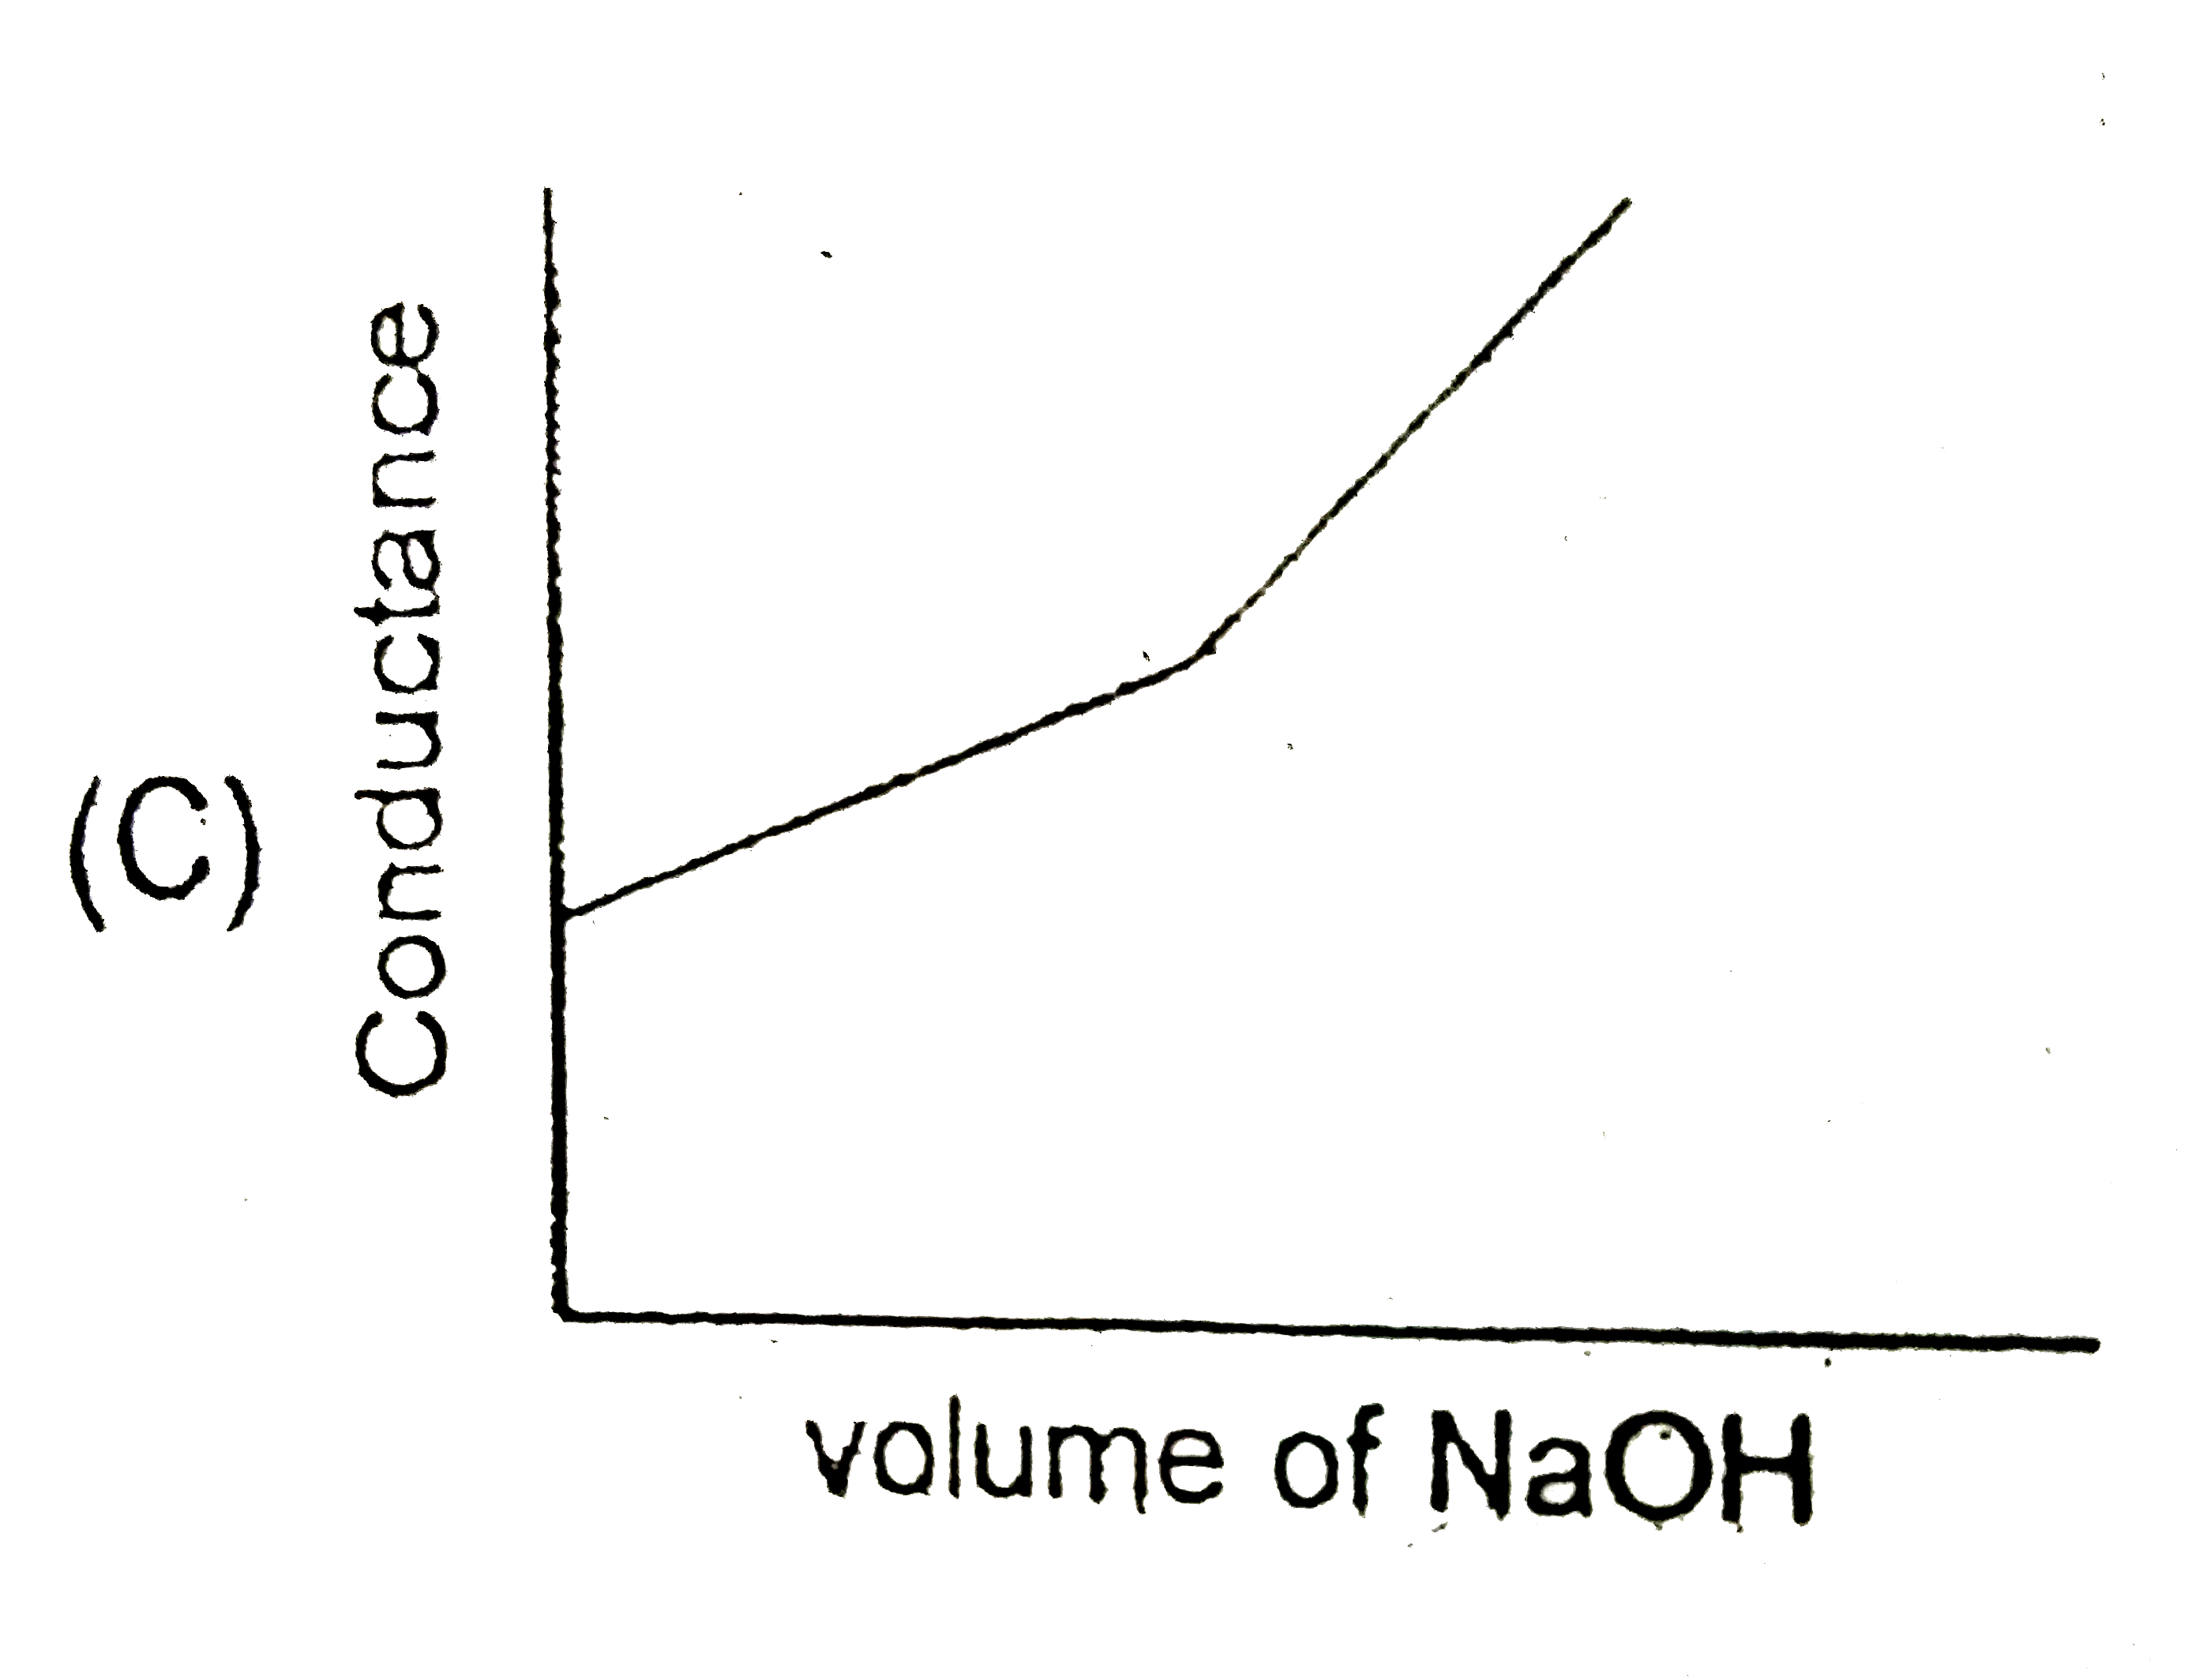 D
D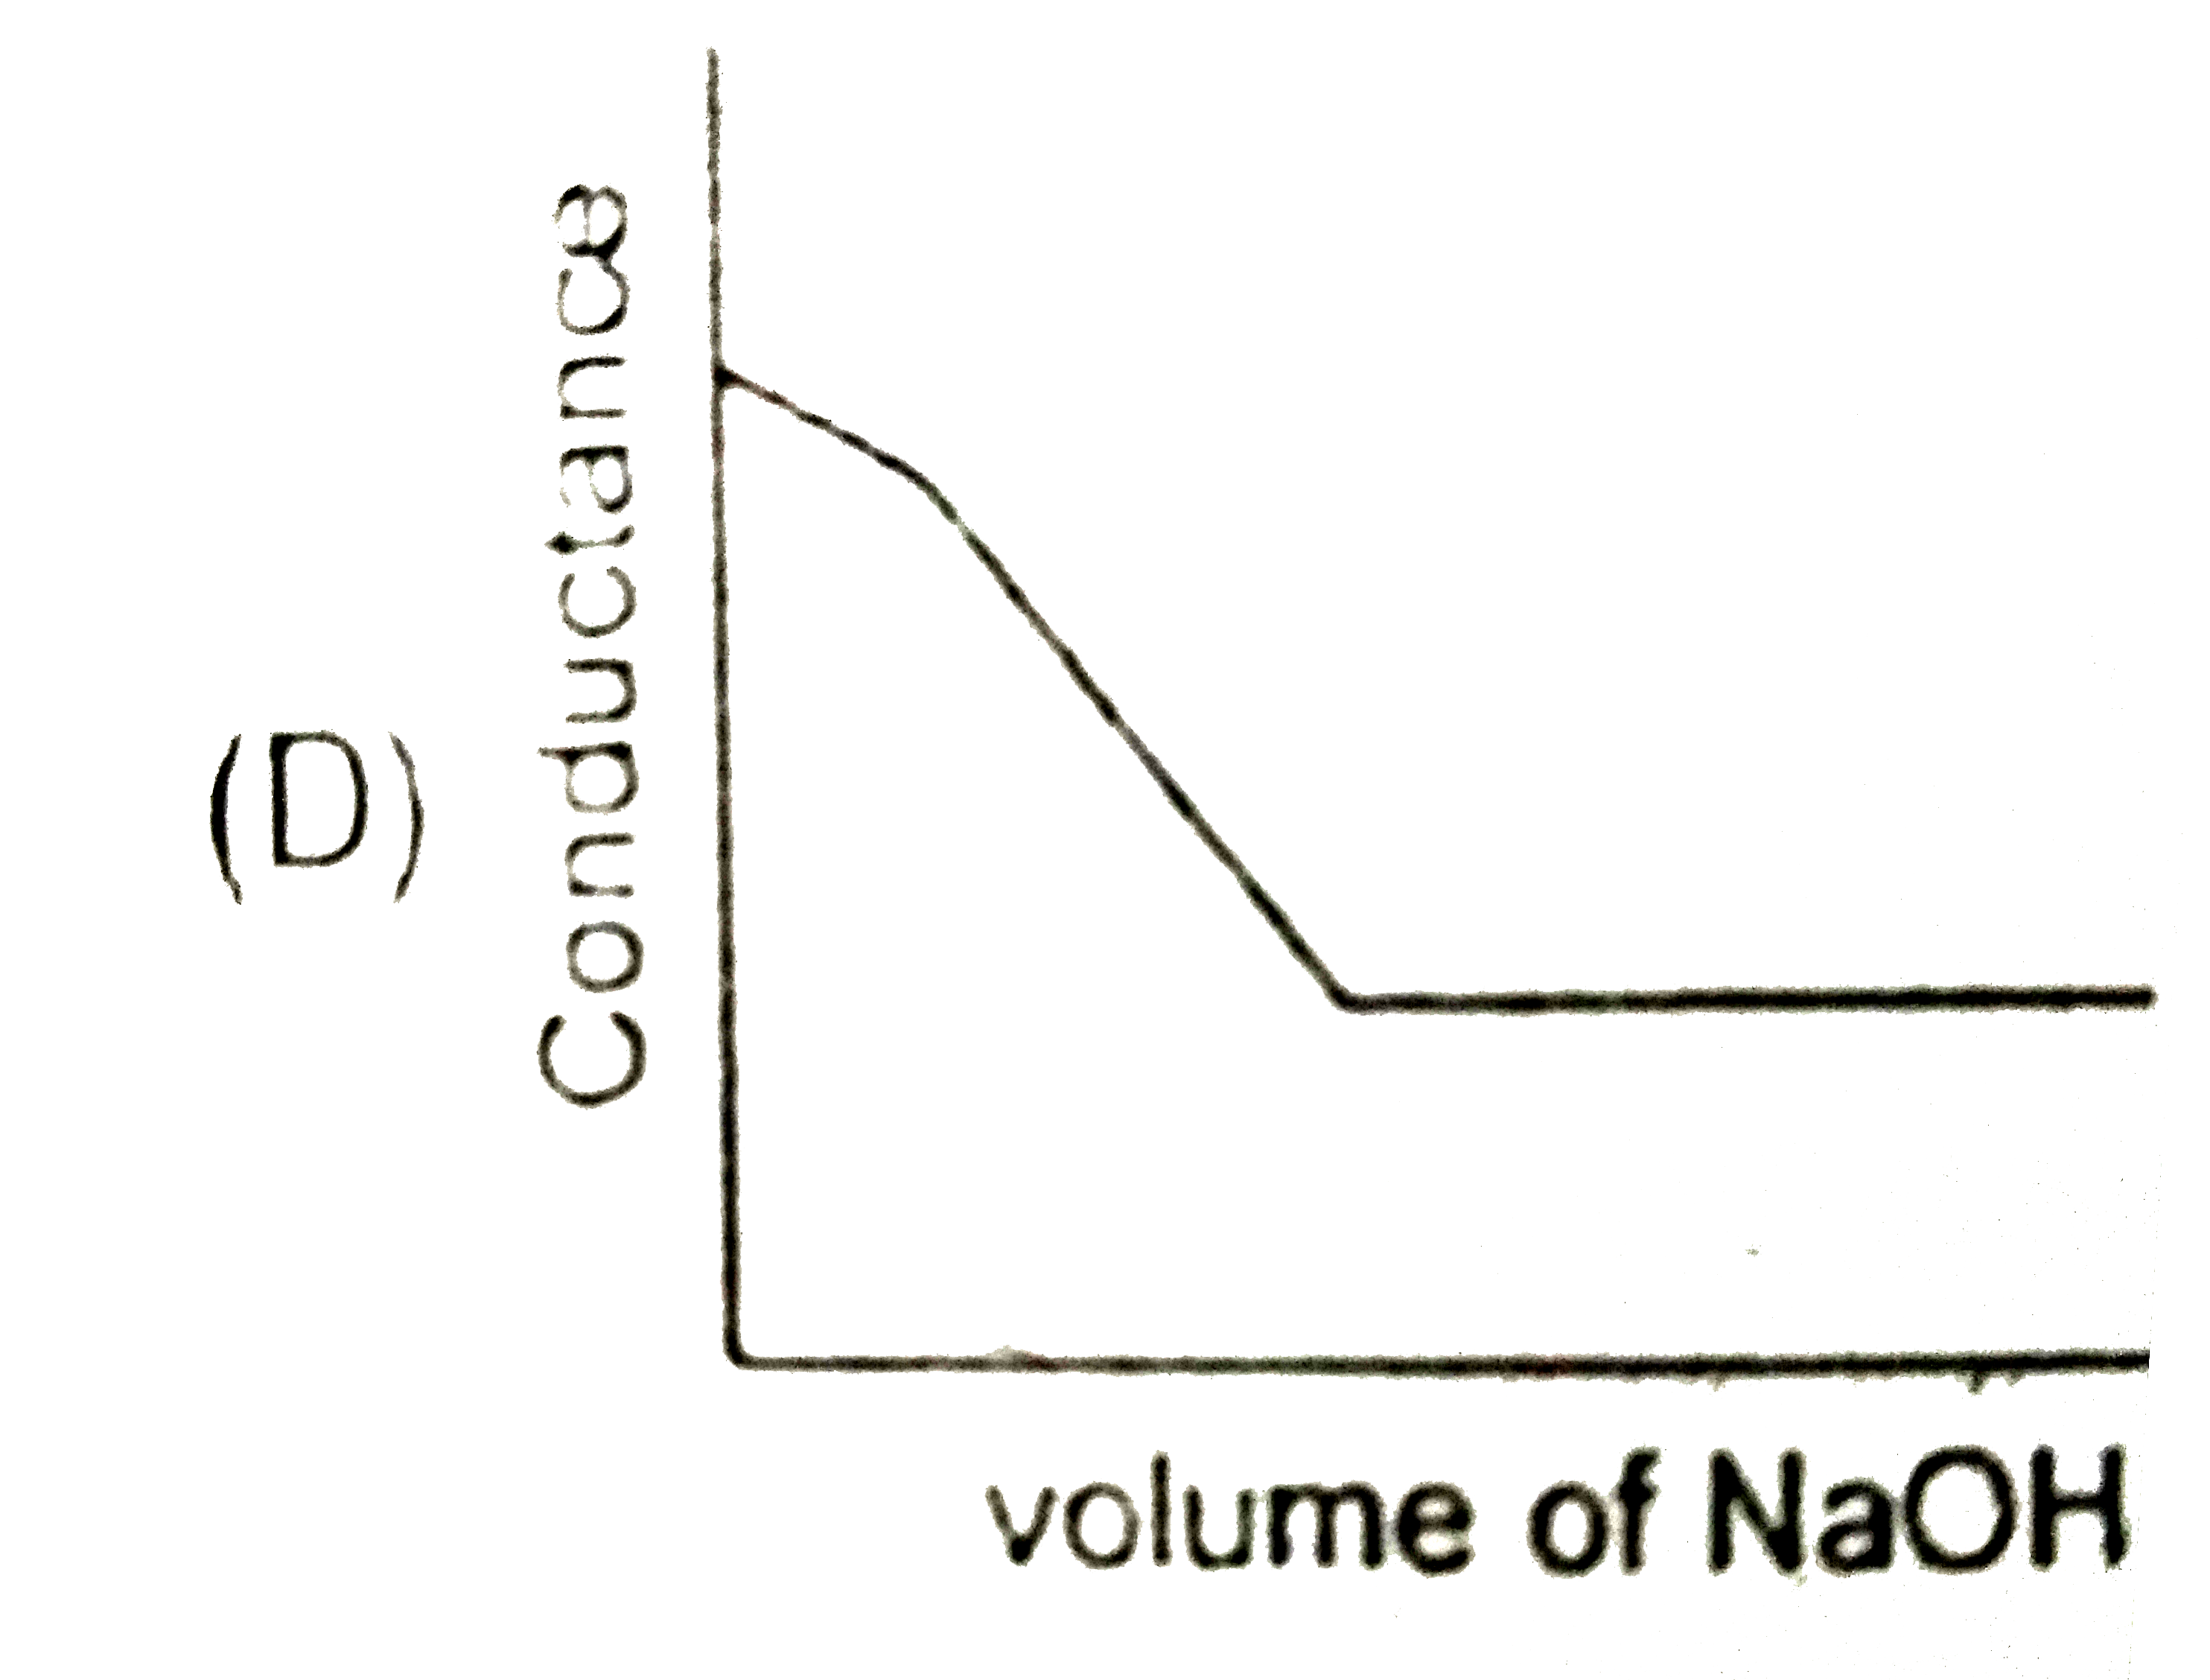

Strong acid versus strong base:
The principle of conductometric titrations is based on the fact that during the titration, one of the ions is replaced by the other and invariable these two ions differ in the ionic conductivity with the result that thhe conductivity of the solution varies during the course of the titration. take, for example, the titration between a strong acid, say HCl, and a string base, say NaOH before NaOH is added, the conductance of HCl solution has a high value due to the presence of highly mobile hydrogen ions. As NaOH is added, H+ ions are replaced by relatively slower moving Na+ ions. consequently the conductance of the solution decreases and this continues right upto the equivalence point where the solution contains only NaCl. Beyond the equivalence point, if more of NaOH is added, then the solution contains a excess of the fast moving OH− ions with the result that its conductance is increased ad it condinues to increase as more and more of NaOH is added. If we plot the conductance value versus the amount of NaOH added, we get a curve of the type shown in Fig. The descending portion AB represents the conductances before the equivalence point (solution contains a mixture of acid HCl and the salt NaCl) and the ascending portion CD represents the conductances after the equivalence point (solution contains the salt NaCl and the excess of NaOH). The point E which represent the minium conductance is due to the solution containing only NaCl with no free acid or alkali and thus represents the equivalence point. this point can, however, be obtained by the extrapolation of the lines AB and DC, and therefore, one is not very particular in locating this point expermentally as it is in the case of ordinary acid-base titrations involving the acid-base indicators.
Weak acid versus strong base:
Let us take specific example of acetic acid being titrated against NaOH. Before the addition of alkali, the solution shows poor conductance due to feeble ionization of acetic acid. Initially the addition of alkali causes not only the replacement of H+ by Na+ but also suppresses the dissociation of acetic acid due to the common ion Ac− and thus the conductance of the solution decreases in the beginning. but very soon the conductance start increasing as addition of NaOH neutralizes the undissociated HAc to Na+Ac− thus causing the replacement of non-conducting HAc with Strong-conducting electrolyte Na+Ac−. the increase in conductance continuous right up to the equivalence point. Beyond this point conductance increases more rapidly with the addition of NaOH due to the highly conducting OH− ions, the graph near the equivalence point is curved due to the hydrolysis of the salt NaAc. The actual equivalence point can, as usual, be obtained by the extrapolation method.
In all these graphs it has been assumed that the volume change due addition of solution from burrette is negnigible, hence volume change of the solution in beaker the conductance of which is measured is almost constant throughout the measurement.
Q. The nature of curve obtained for the titration between weak acid versus strong base as described in the above passage will be:
View SolutionName an instrument that measures potential difference between two points in a circuit.
Difine the unit of potential difference in terms of SI unit of charge and work . Draw the
circuit symbols for a (i) veribale resisitor , (ii) a plug key which is closed one .
Two electric circutirs I and II are shown below.
(i) Which of the two circuits has more resistance?
(ii) Through which circuit more current passes?
(iii) In which circuit, the potential difference across each resistor is equal?
(iv) If R1>R2>R3, in which circuit more heat will be produced in R1 as compared to
other two resistors?
 .
.
View SolutionName an instrument that measures potential difference between two points in a circuit.
Difine the unit of potential difference in terms of SI unit of charge and work . Draw the
circuit symbols for a (i) veribale resisitor , (ii) a plug key which is closed one .
Two electric circutirs I and II are shown below.
(i) Which of the two circuits has more resistance?
(ii) Through which circuit more current passes?
(iii) In which circuit, the potential difference across each resistor is equal?
(iv) If R1>R2>R3, in which circuit more heat will be produced in R1 as compared to
other two resistors?
 .
.
View Solution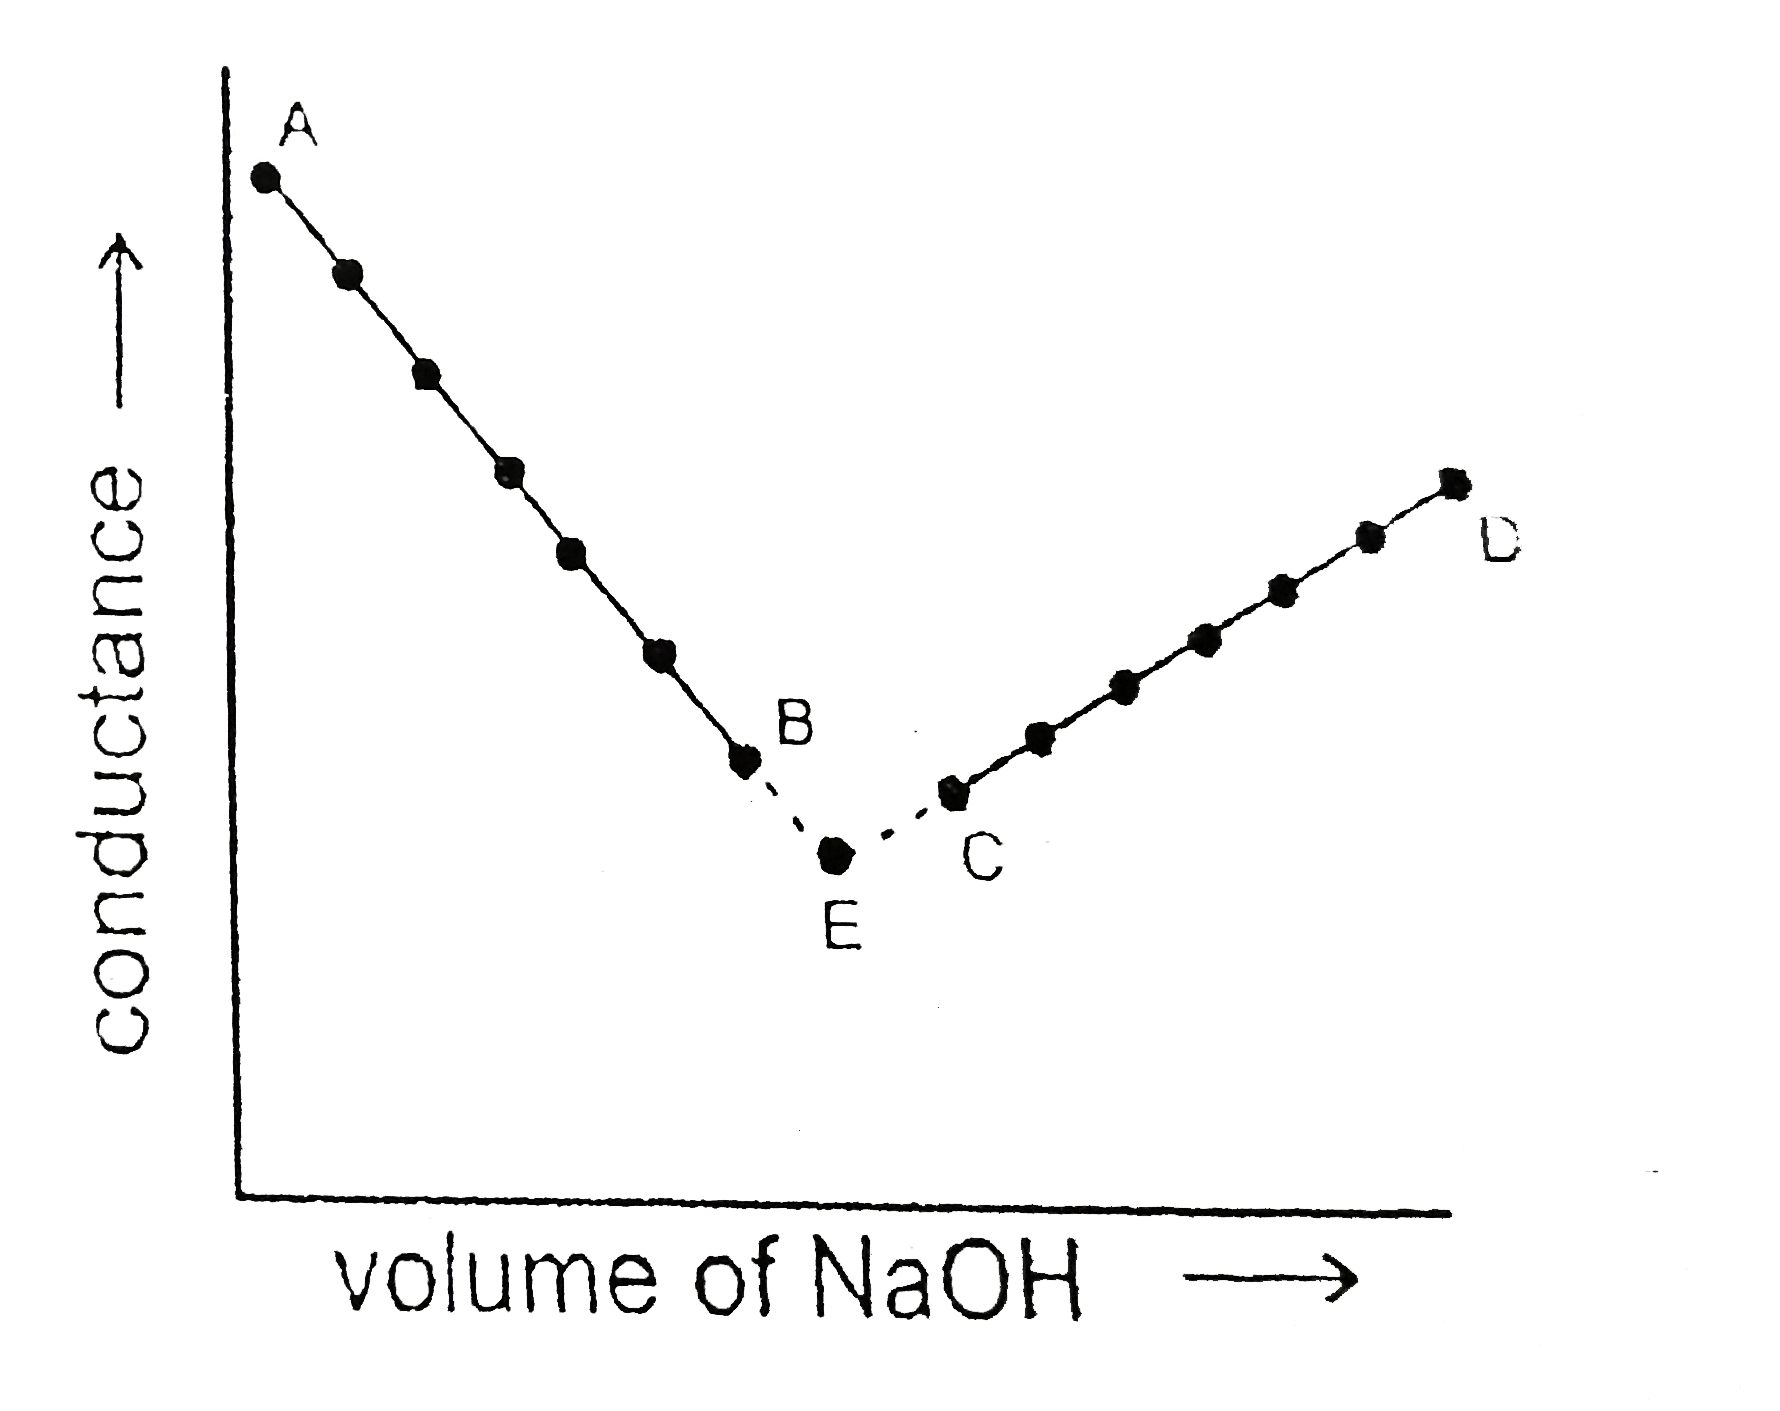
Strong acid versus strong base:
The principle of conductometric titrations is based on the fact that during the titration, one of the ions is replaced by the other and invariable these two ions differ in the ionic conductivity with the result that thhe conductivity of the solution varies during the course of the titration. take, for example, the titration between a strong acid, say HCl, and a string base, say NaOH before NaOH is added, the conductance of HCl solution has a high value due to the presence of highly mobile hydrogen ions. As NaOH is added, H+ ions are replaced by relatively slower moving Na+ ions. consequently the conductance of the solution decreases and this continues right upto the equivalence point where the solution contains only NaCl. Beyond the equivalence point, if more of NaOH is added, then the solution contains a excess of the fast moving OH− ions with the result that its conductance is increased ad it condinues to increase as more and more of NaOH is added. If we plot the conductance value versus the amount of NaOH added, we get a curve of the type shown in Fig. The descending portion AB represents the conductances before the equivalence point (solution contains a mixture of acid HCl and the salt NaCl) and the ascending portion CD represents the conductances after the equivalence point (solution contains the salt NaCl and the excess of NaOH). The point E which represent the minium conductance is due to the solution containing only NaCl with no free acid or alkali and thus represents the equivalence point. this point can, however, be obtained by the extrapolation of the lines AB and DC, and therefore, one is not very particular in locating this point expermentally as it is in the case of ordinary acid-base titrations involving the acid-base indicators.
Weak acid versus strong base:
Let us take specific example of acetic acid being titrated against NaOH. Before the addition of alkali, the solution shows poor conductance due to feeble ionization of acetic acid. Initially the addition of alkali causes not only the replacement of H+ by Na+ but also suppresses the dissociation of acetic acid due to the common ion Ac− and thus the conductance of the solution decreases in the beginning. but very soon the conductance start increasing as addition of NaOH neutralizes the undissociated HAc to Na+Ac− thus causing the replacement of non-conducting HAc with Strong-conducting electrolyte Na+Ac−. the increase in conductance continuous right up to the equivalence point. Beyond this point conductance increases more rapidly with the addition of NaOH due to the highly conducting OH− ions, the graph near the equivalence point is curved due to the hydrolysis of the salt NaAc. The actual equivalence point can, as usual, be obtained by the extrapolation method.
In all these graphs it has been assumed that the volume change due addition of solution from burrette is negnigible, hence volume change of the solution in beaker the conductance of which is measured is almost constant throughout the measurement.
Q. The most appropriate titration curve obtained when a mixture of a strong acid (say HCl) and a weak acid (say CH3COOH) is titrated with a strong base (say NaOH) will be
View Solution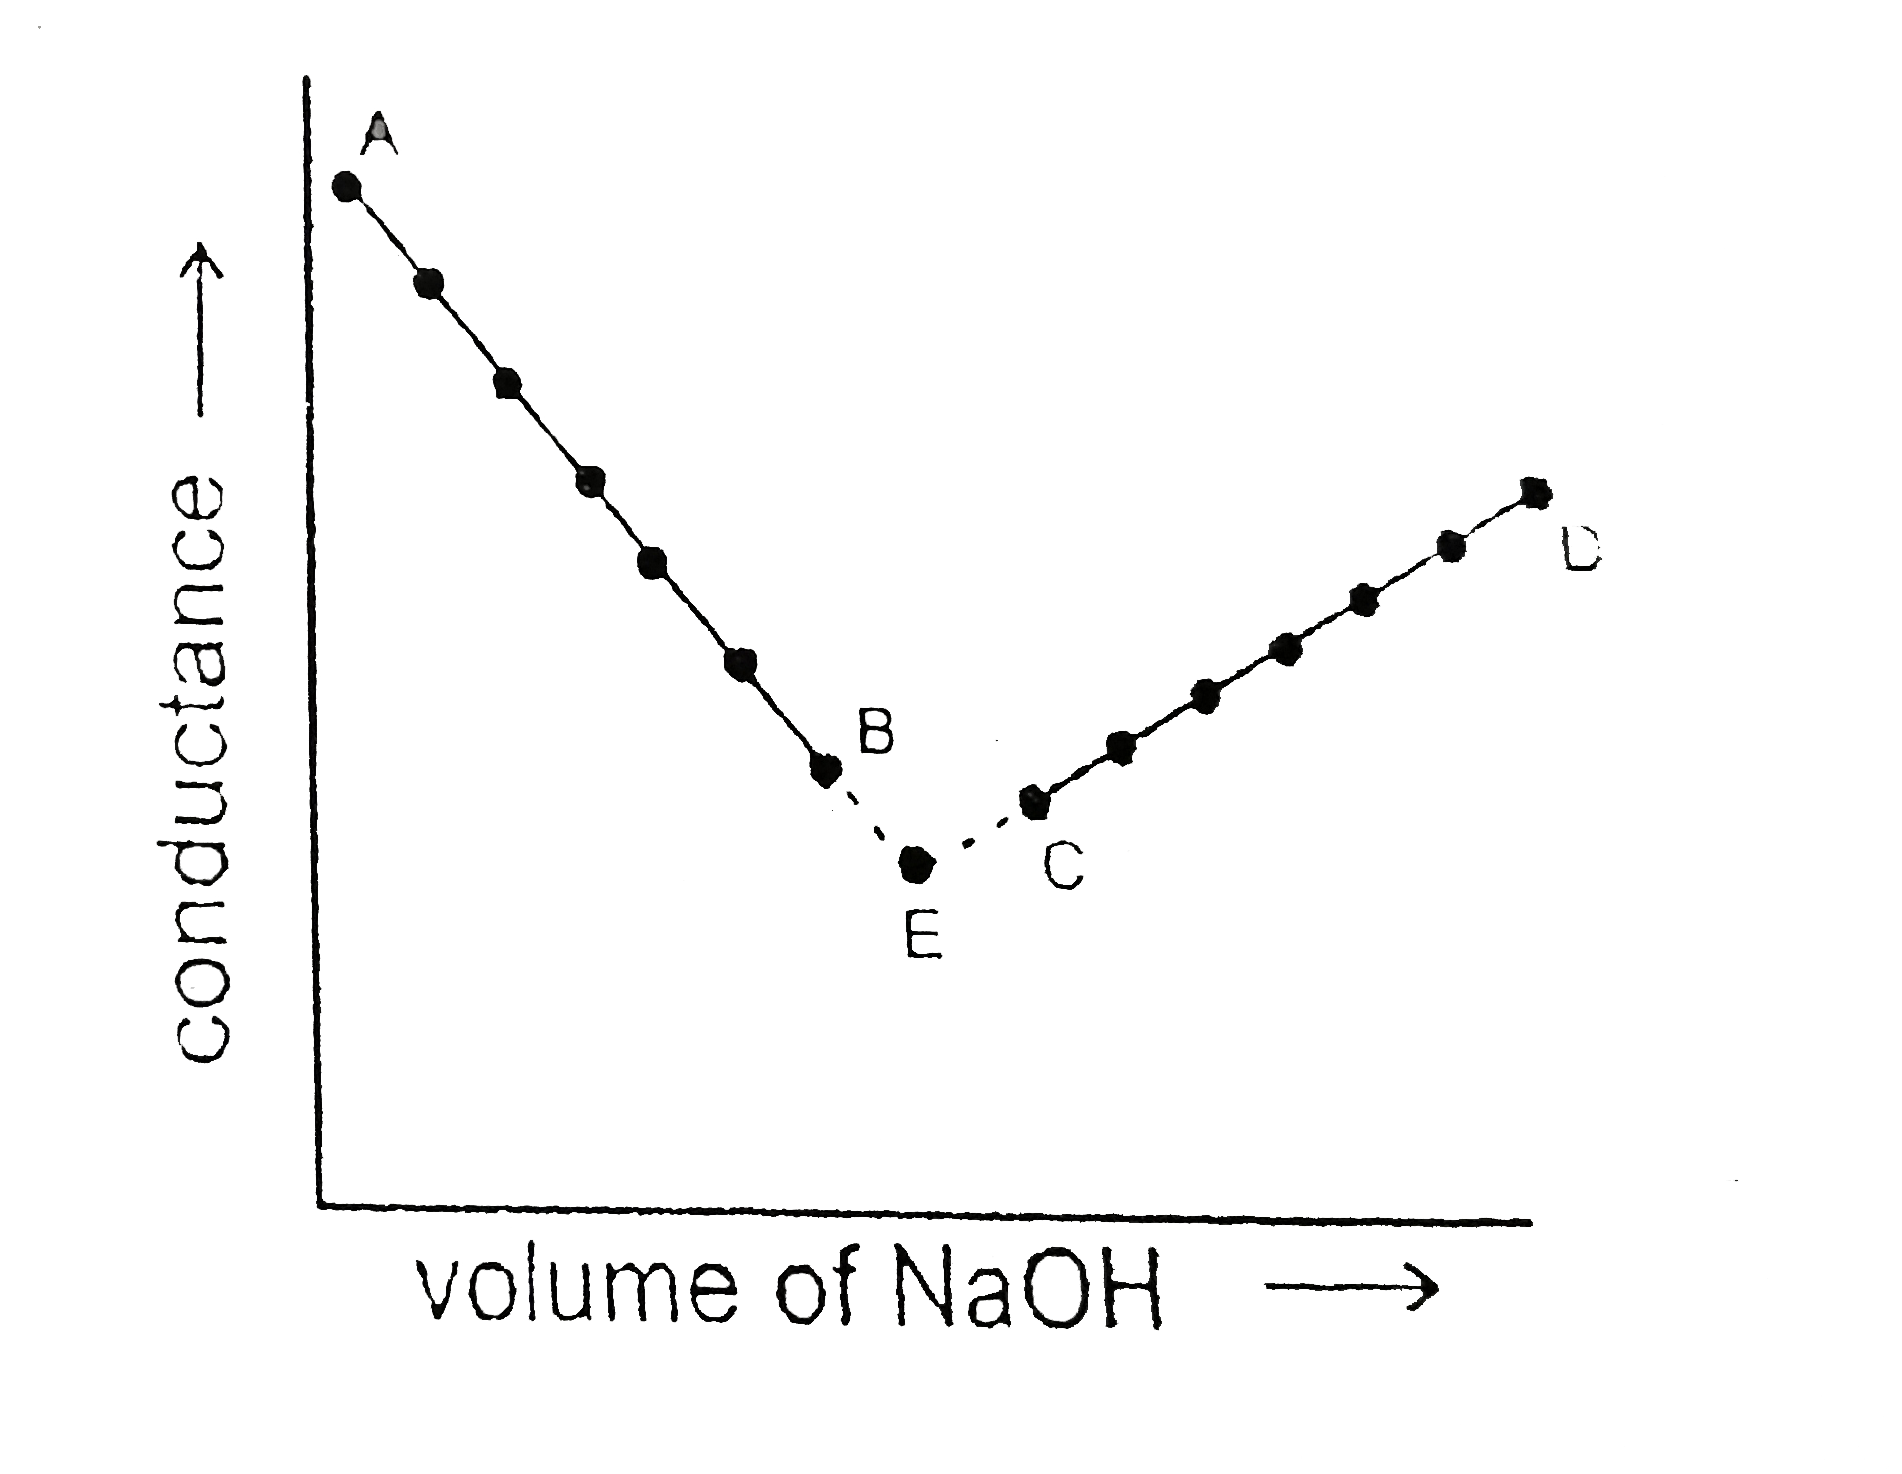
Strong acid versus strong base:
The principle of conductometric titrations is based on the fact that during the titration, one of the ions is replaced by the other and invariable these two ions differ in the ionic conductivity with the result that thhe conductivity of the solution varies during the course of the titration. take, for example, the titration between a strong acid, say HCl, and a string base, say NaOH before NaOH is added, the conductance of HCl solution has a high value due to the presence of highly mobile hydrogen ions. As NaOH is added, H+ ions are replaced by relatively slower moving Na+ ions. consequently the conductance of the solution decreases and this continues right upto the equivalence point where the solution contains only NaCl. Beyond the equivalence point, if more of NaOH is added, then the solution contains a excess of the fast moving OH− ions with the result that its conductance is increased ad it condinues to increase as more and more of NaOH is added. If we plot the conductance value versus the amount of NaOH added, we get a curve of the type shown in Fig. The descending portion AB represents the conductances before the equivalence point (solution contains a mixture of acid HCl and the salt NaCl) and the ascending portion CD represents the conductances after the equivalence point (solution contains the salt NaCl and the excess of NaOH). The point E which represent the minium conductance is due to the solution containing only NaCl with no free acid or alkali and thus represents the equivalence point. this point can, however, be obtained by the extrapolation of the lines AB and DC, and therefore, one is not very particular in locating this point expermentally as it is in the case of ordinary acid-base titrations involving the acid-base indicators.
Weak acid versus strong base:
Let us take specific example of acetic acid being titrated against NaOH. Before the addition of alkali, the solution shows poor conductance due to feeble ionization of acetic acid. Initially the addition of alkali causes not only the replacement of H+ by Na+ but also suppresses the dissociation of acetic acid due to the common ion Ac− and thus the conductance of the solution decreases in the beginning. but very soon the conductance start increasing as addition of NaOH neutralizes the undissociated HAc to Na+Ac− thus causing the replacement of non-conducting HAc with Strong-conducting electrolyte Na+Ac−. the increase in conductance continuous right up to the equivalence point. Beyond this point conductance increases more rapidly with the addition of NaOH due to the highly conducting OH− ions, the graph near the equivalence point is curved due to the hydrolysis of the salt NaAc. The actual equivalence point can, as usual, be obtained by the extrapolation method.
In all these graphs it has been assumed that the volume change due addition of solution from burrette is negnigible, hence volume change of the solution in beaker the conductance of which is measured is almost constant throughout the measurement.
Q. If a 100 mL solution of 0.1 M HBr is titrated using a very concentrated solution of NaOH, then the conductivity (specific conductance) of this solution at the equivalence point will be (assume volume change is negligible due to addition of NaoH) report your answer after multipling it with 10 in Sm−1
[Given λ∘(Na+)=8×10⁻³Sm2mol−1,λ∘(Br−)=4×10⁻³Sm2mol−1]
View Solution
