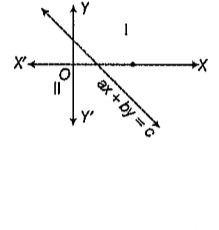
The graph of the inequality ax+by gt c is represented by shading in the …A…. .Here, A refers to
A
half plane I including the point on ax+by=c
B
half plane II including the point on ax+by=c
C
half plane I not including the point on ax+by=c
D
half plane II not including the point on ax+by =c
Text Solution
The correct Answer is:C
|
Similar Questions
Knowledge Check
The solution of the inequality 3x+2y>6in the graph is represented by shading the
AHalf plane, which contains origin including the points on the lineBHalf plane , which does not contain origin excluding the points on the lineCHalf plane, which does not contain origin including the point on the lineDHalf plane, which contain origin excluding the points on the lineThe inequality a+ib>c+ is true when
Aa>c,b>d>0Ba>c,b=d=0Ca>c,b=d>0DNone of theseThe shaded region for the inequality x+5y≤6 is
Aat the non-origin side of x+5y=6Bto the origin side of x+5y=6Cto the either side of x+5y=6Dto the either side of x−5y=6
The graph of the inequation 3x+2y>6 does not lie in the 4th quadrant.(True/False)
View SolutionThe inequation represent by the following graph is
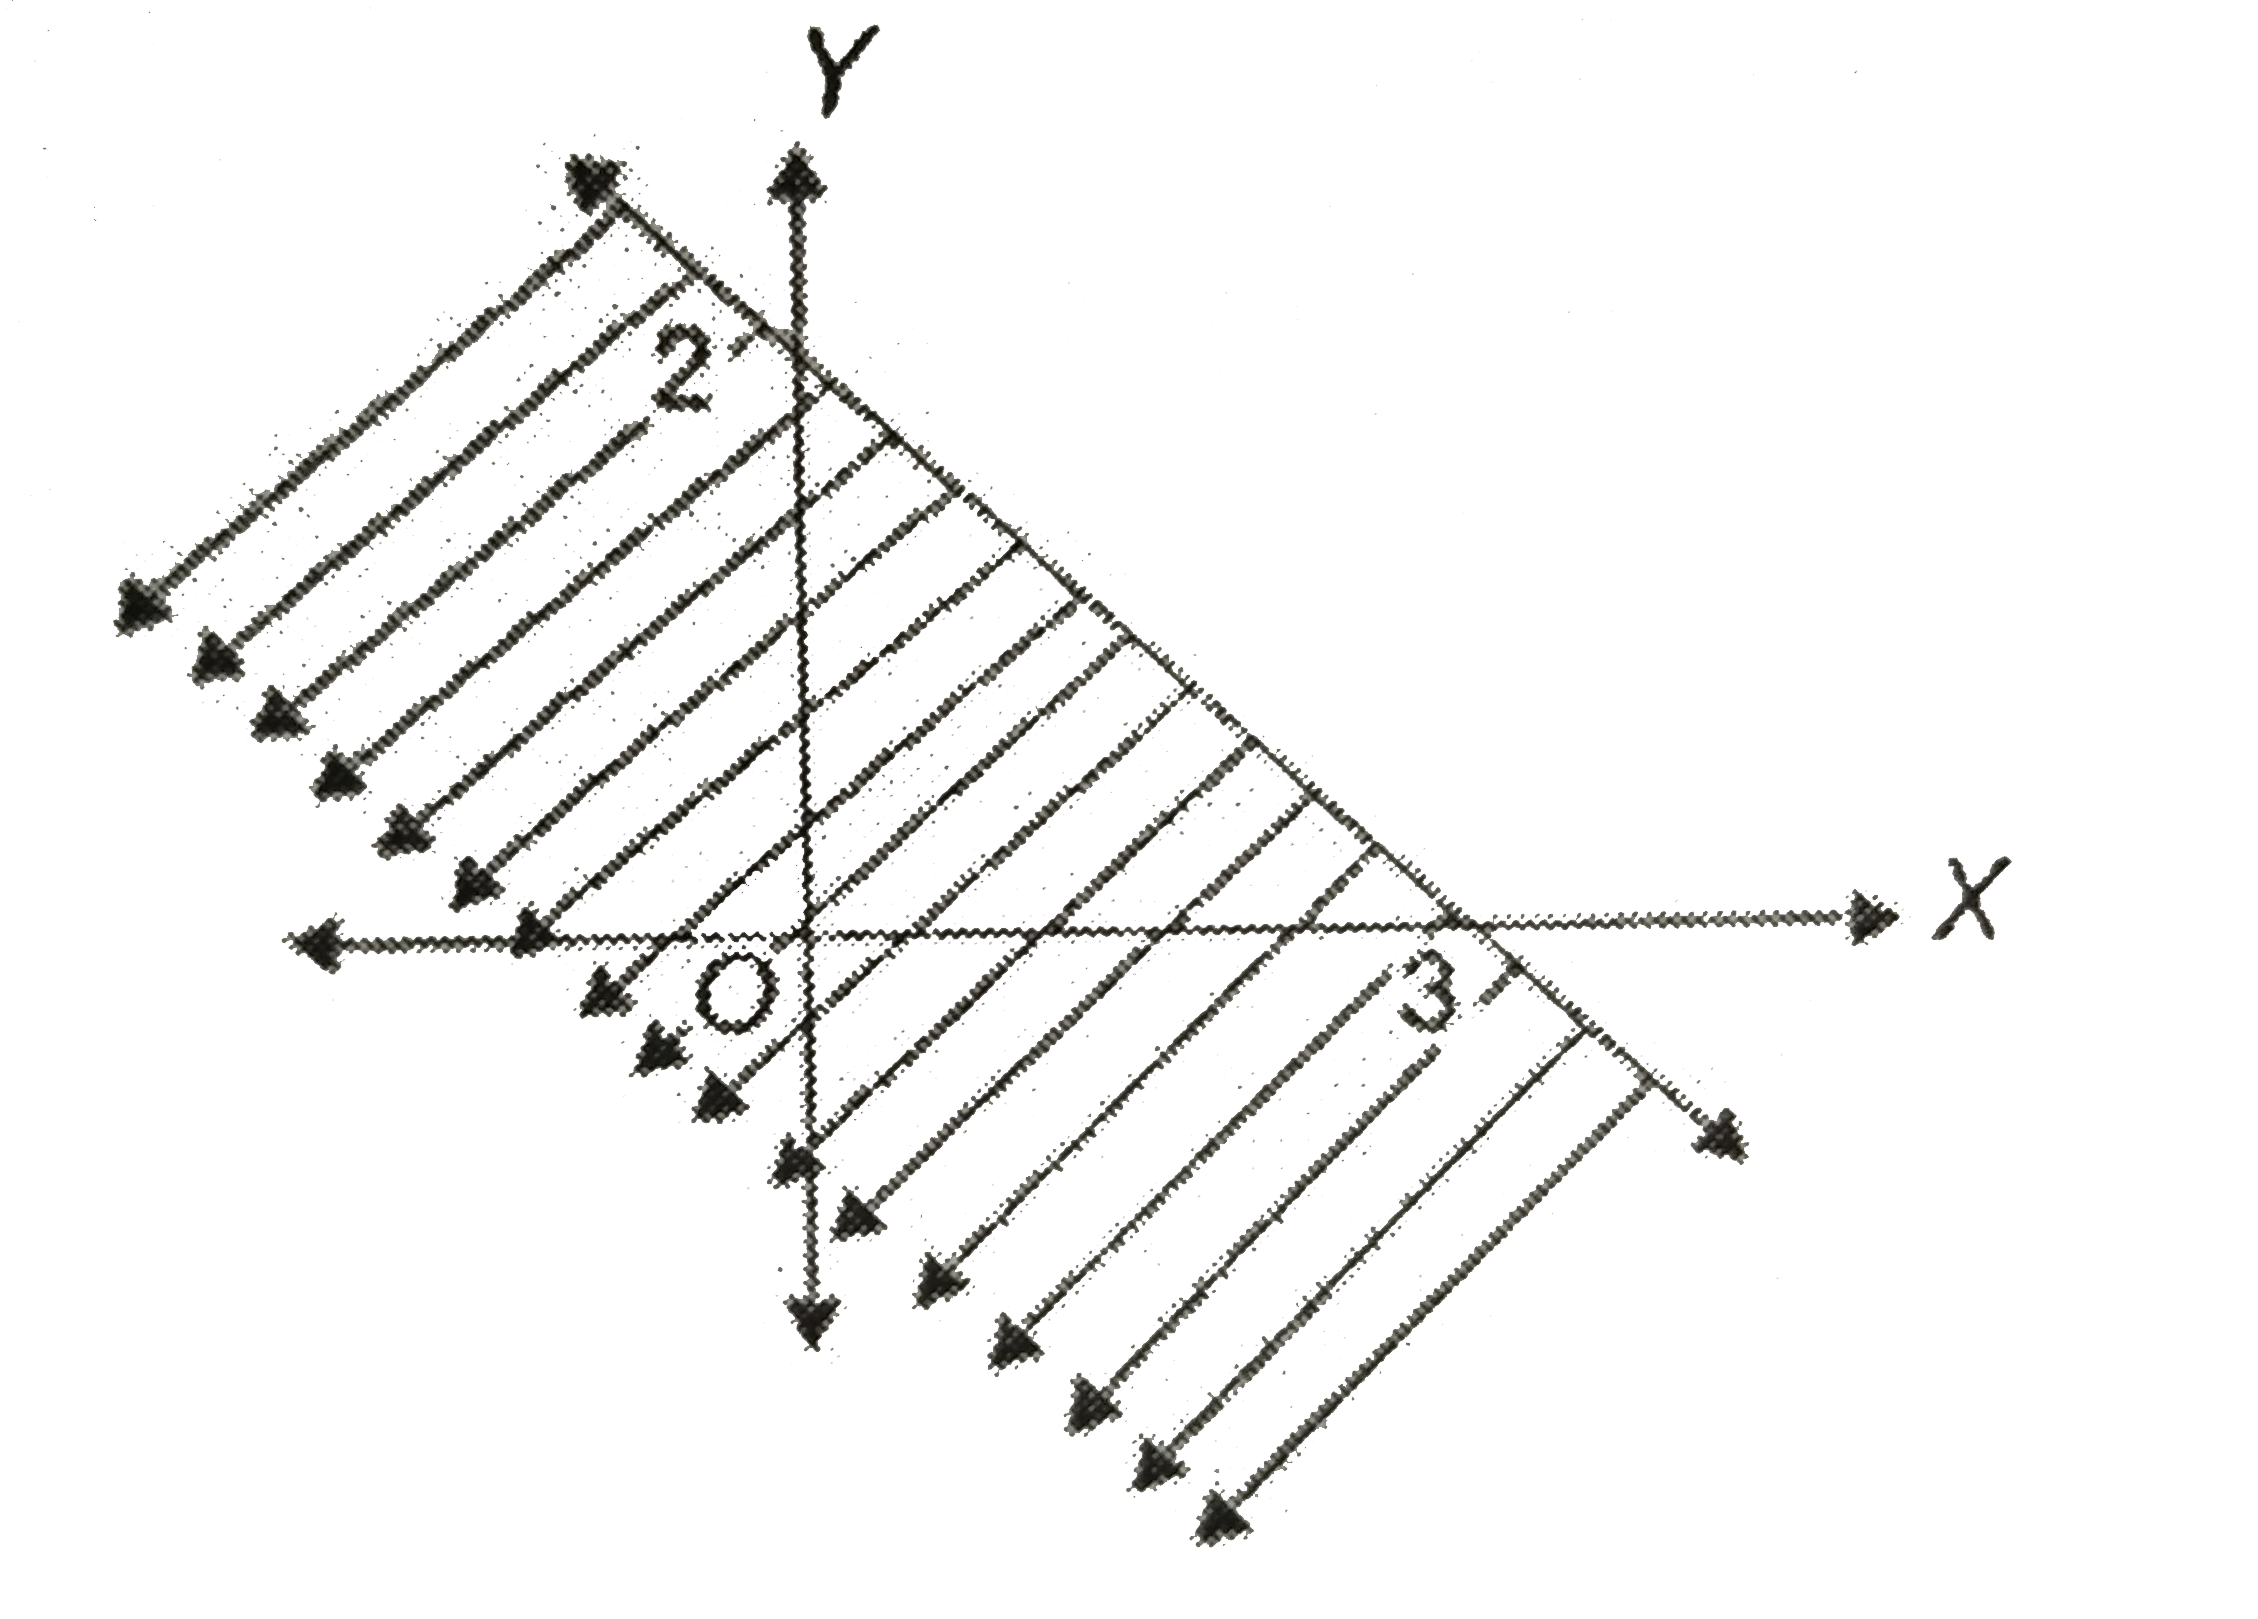
View SolutionThe graph of ax+by+c=0 is
View SolutionWhich of the following inequations represents the shaded region?
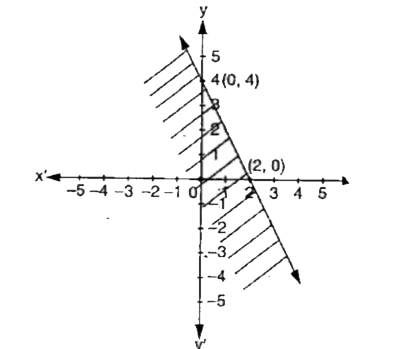
View SolutionThe shaded region is represented by the inequation:
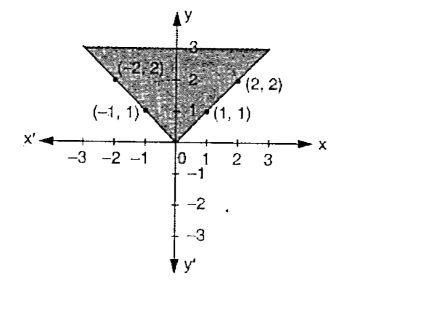
View Solution

