Suppose that the acceleration versus time graph of a particle that starts from rest at t = 0 is as shown in the figure :
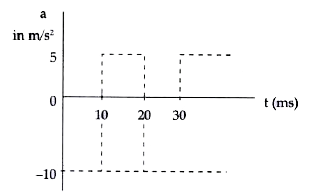
At what instant does the particle come to rest for the first time ?
5 s
10 s
15 s
The particle never comes to rest
The correct Answer is:C
From the given graph, it is clear that the area under the acceleration graph for a certain interval of time is equal to the charge in velocity during that time interval.
Let at time .t. speed become zero, then
5×10⁻¹⁰×(t−10)=0
50−10t+100=0
t=15010
t = 15 s
Similar Questions
Knowledge Check
Suppose that the acceleration versus time graph of a particle that starts from rest at t = 0 is as shown in the figure :

At what instant does the particle come to rest for the first time ?A5 sB10 sC15 sDThe particle never comes to restSuppose that the acceleration versus time graph of a particle that starts from rest at t = 0 is as shown in the figure :
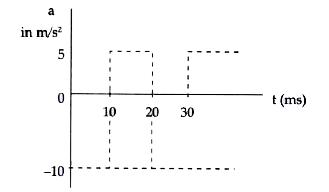
What is the total distance travelled by the particle during 30 s ?A0 mB500 mC750 mD1000 mA graph of acceleration versus time of a particle starting from rest at t=0 is as shown in figure. The speed of the particle at t=14s is
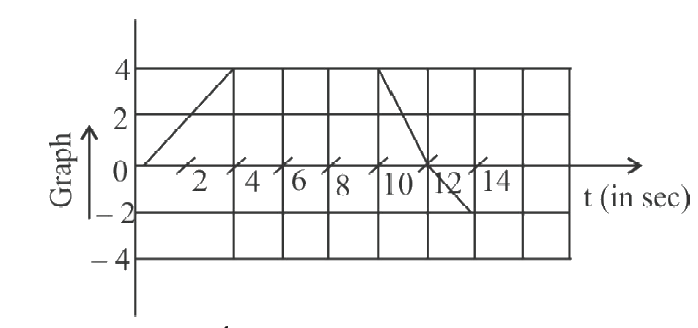 A2ms−1B34ms−1C20ms−1D42ms−1
A particle starts from rest. Its acceleration is varying with time as shown in the figure. When the particle comes to rest, its distance from its starting point is
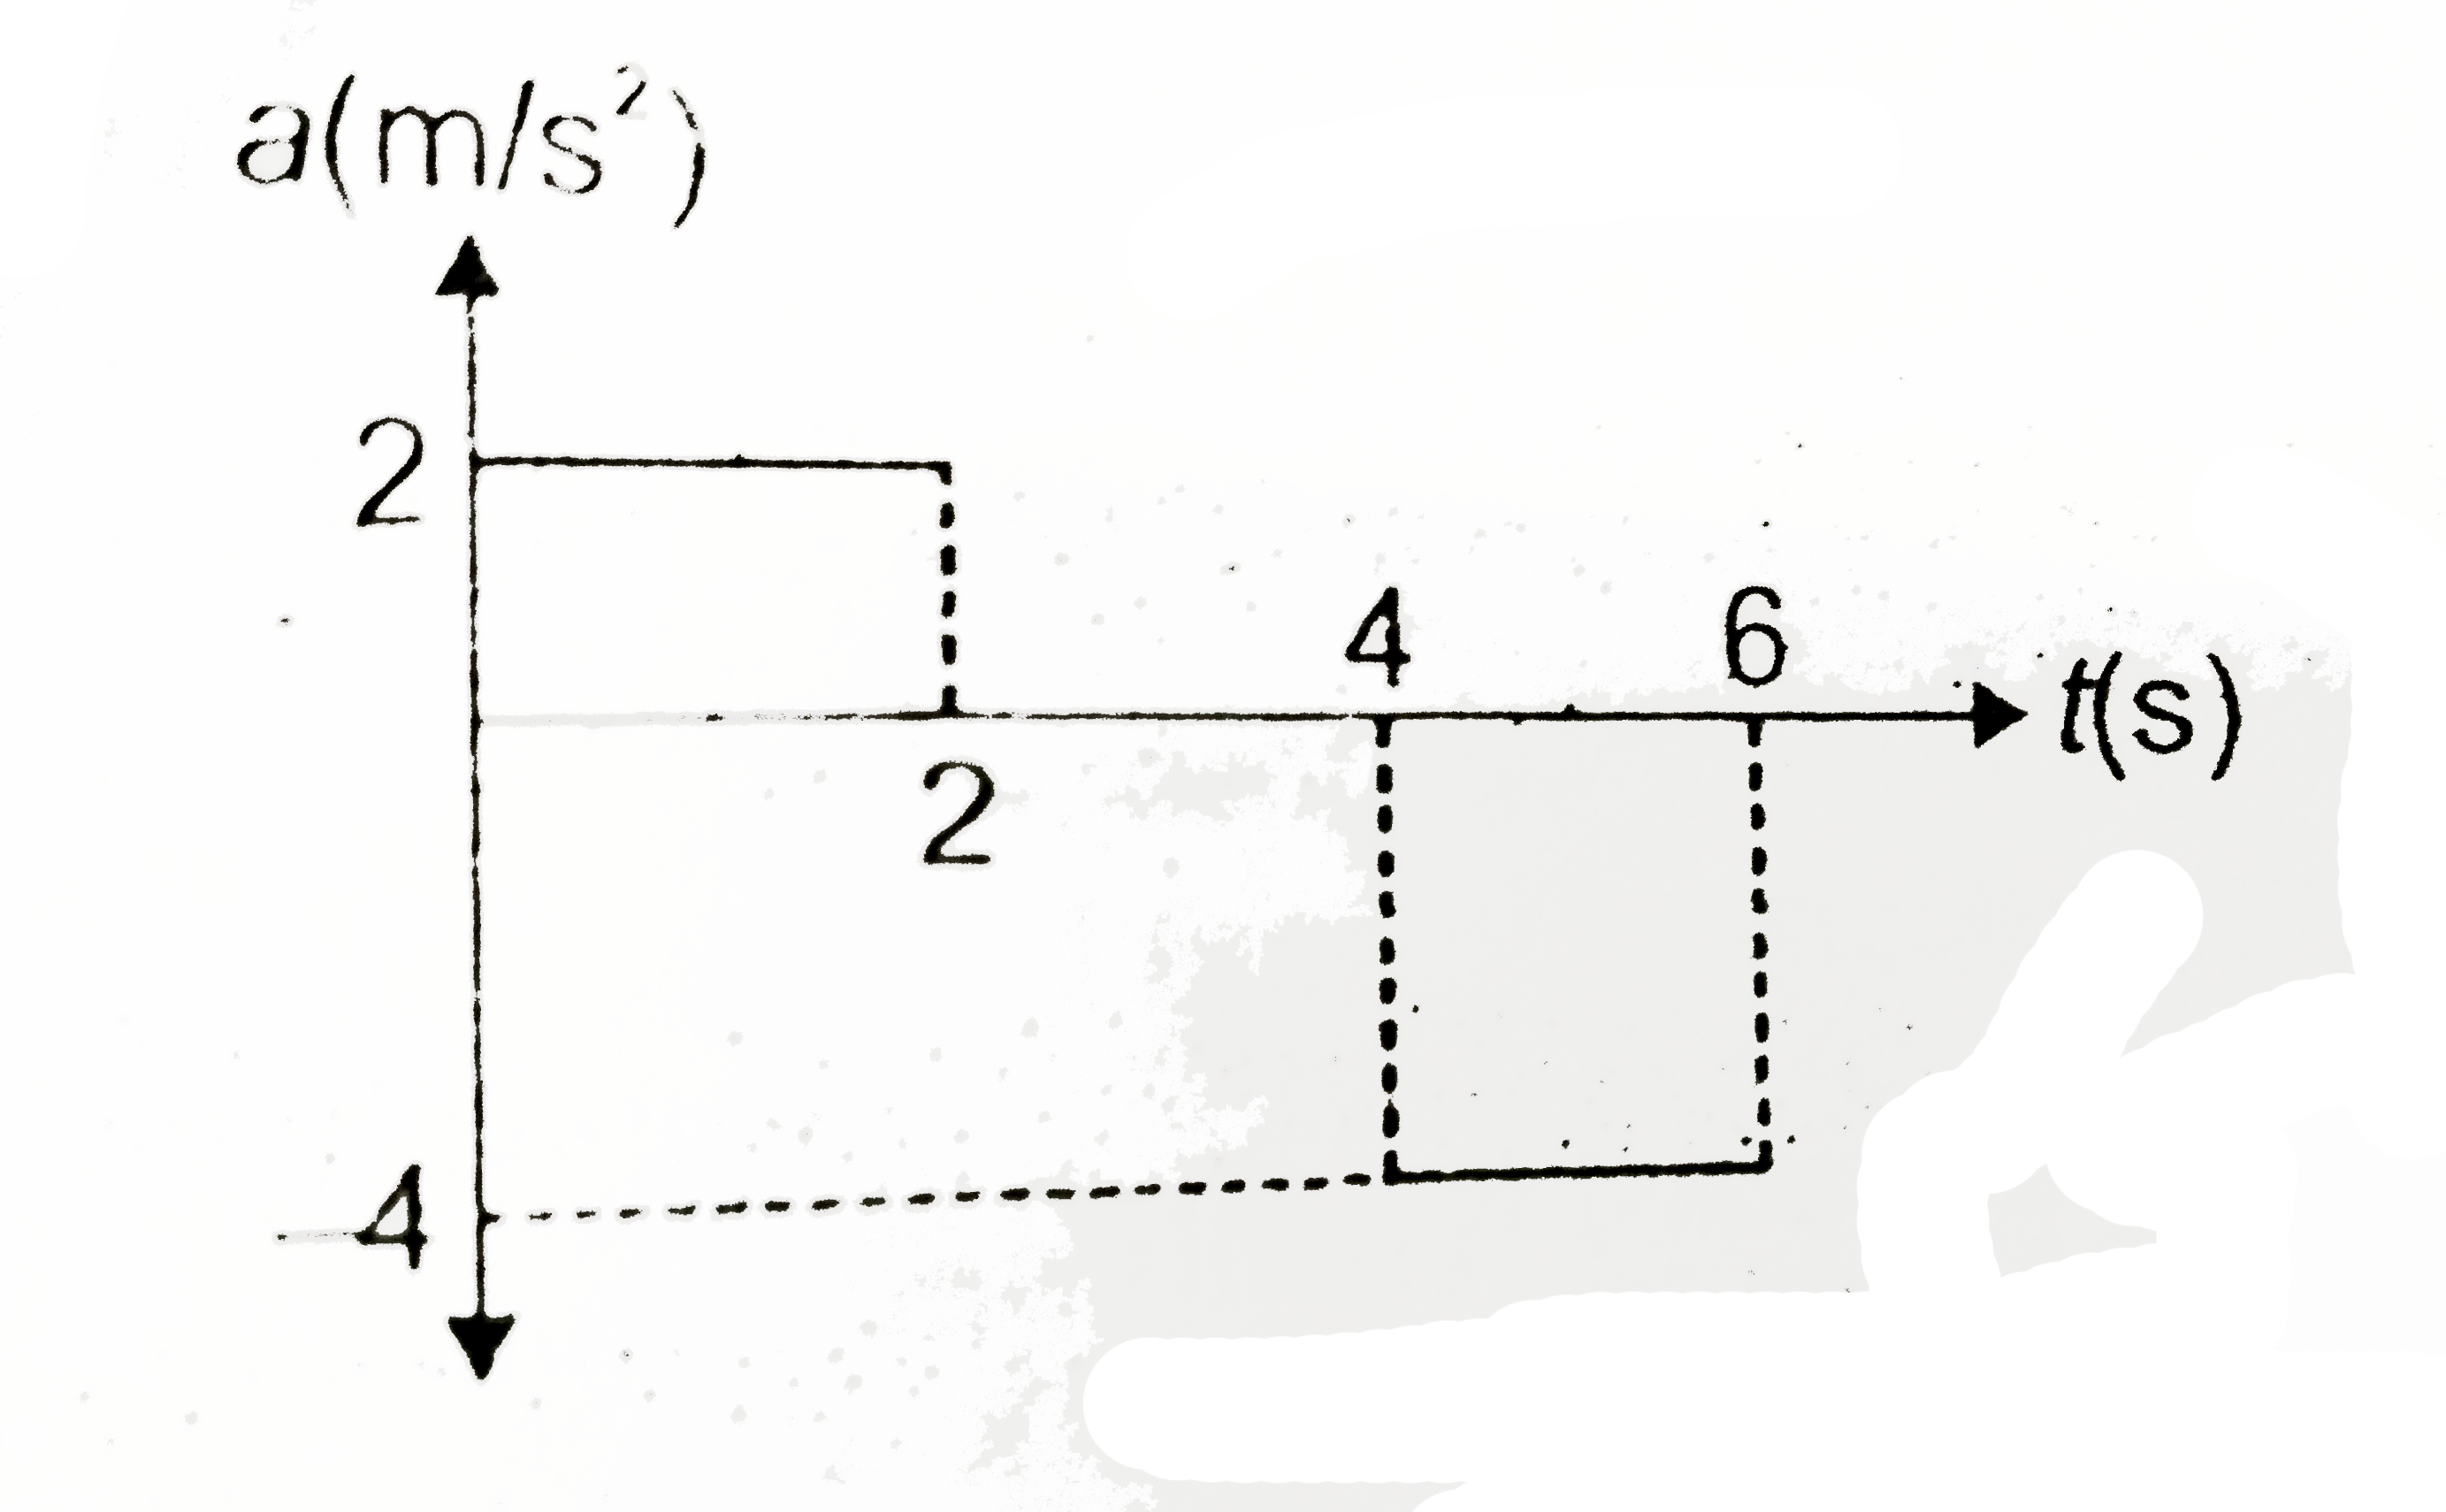
View SolutionA particle starts from rest. Its acceleration is varying with time as shown in the figure. When the particle comes to rest, its distance from its starting point is

View SolutionA graph of acceleration versus time of a particle starting from rest at t =0 is shown. The speed of the particle at t=14 second is
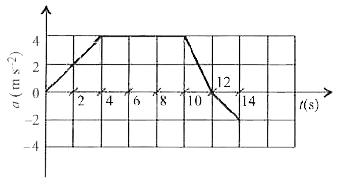
View SolutionThe acceleration versus time graph of a particle is shown in the figure. The respective v−t graph of the particle is .
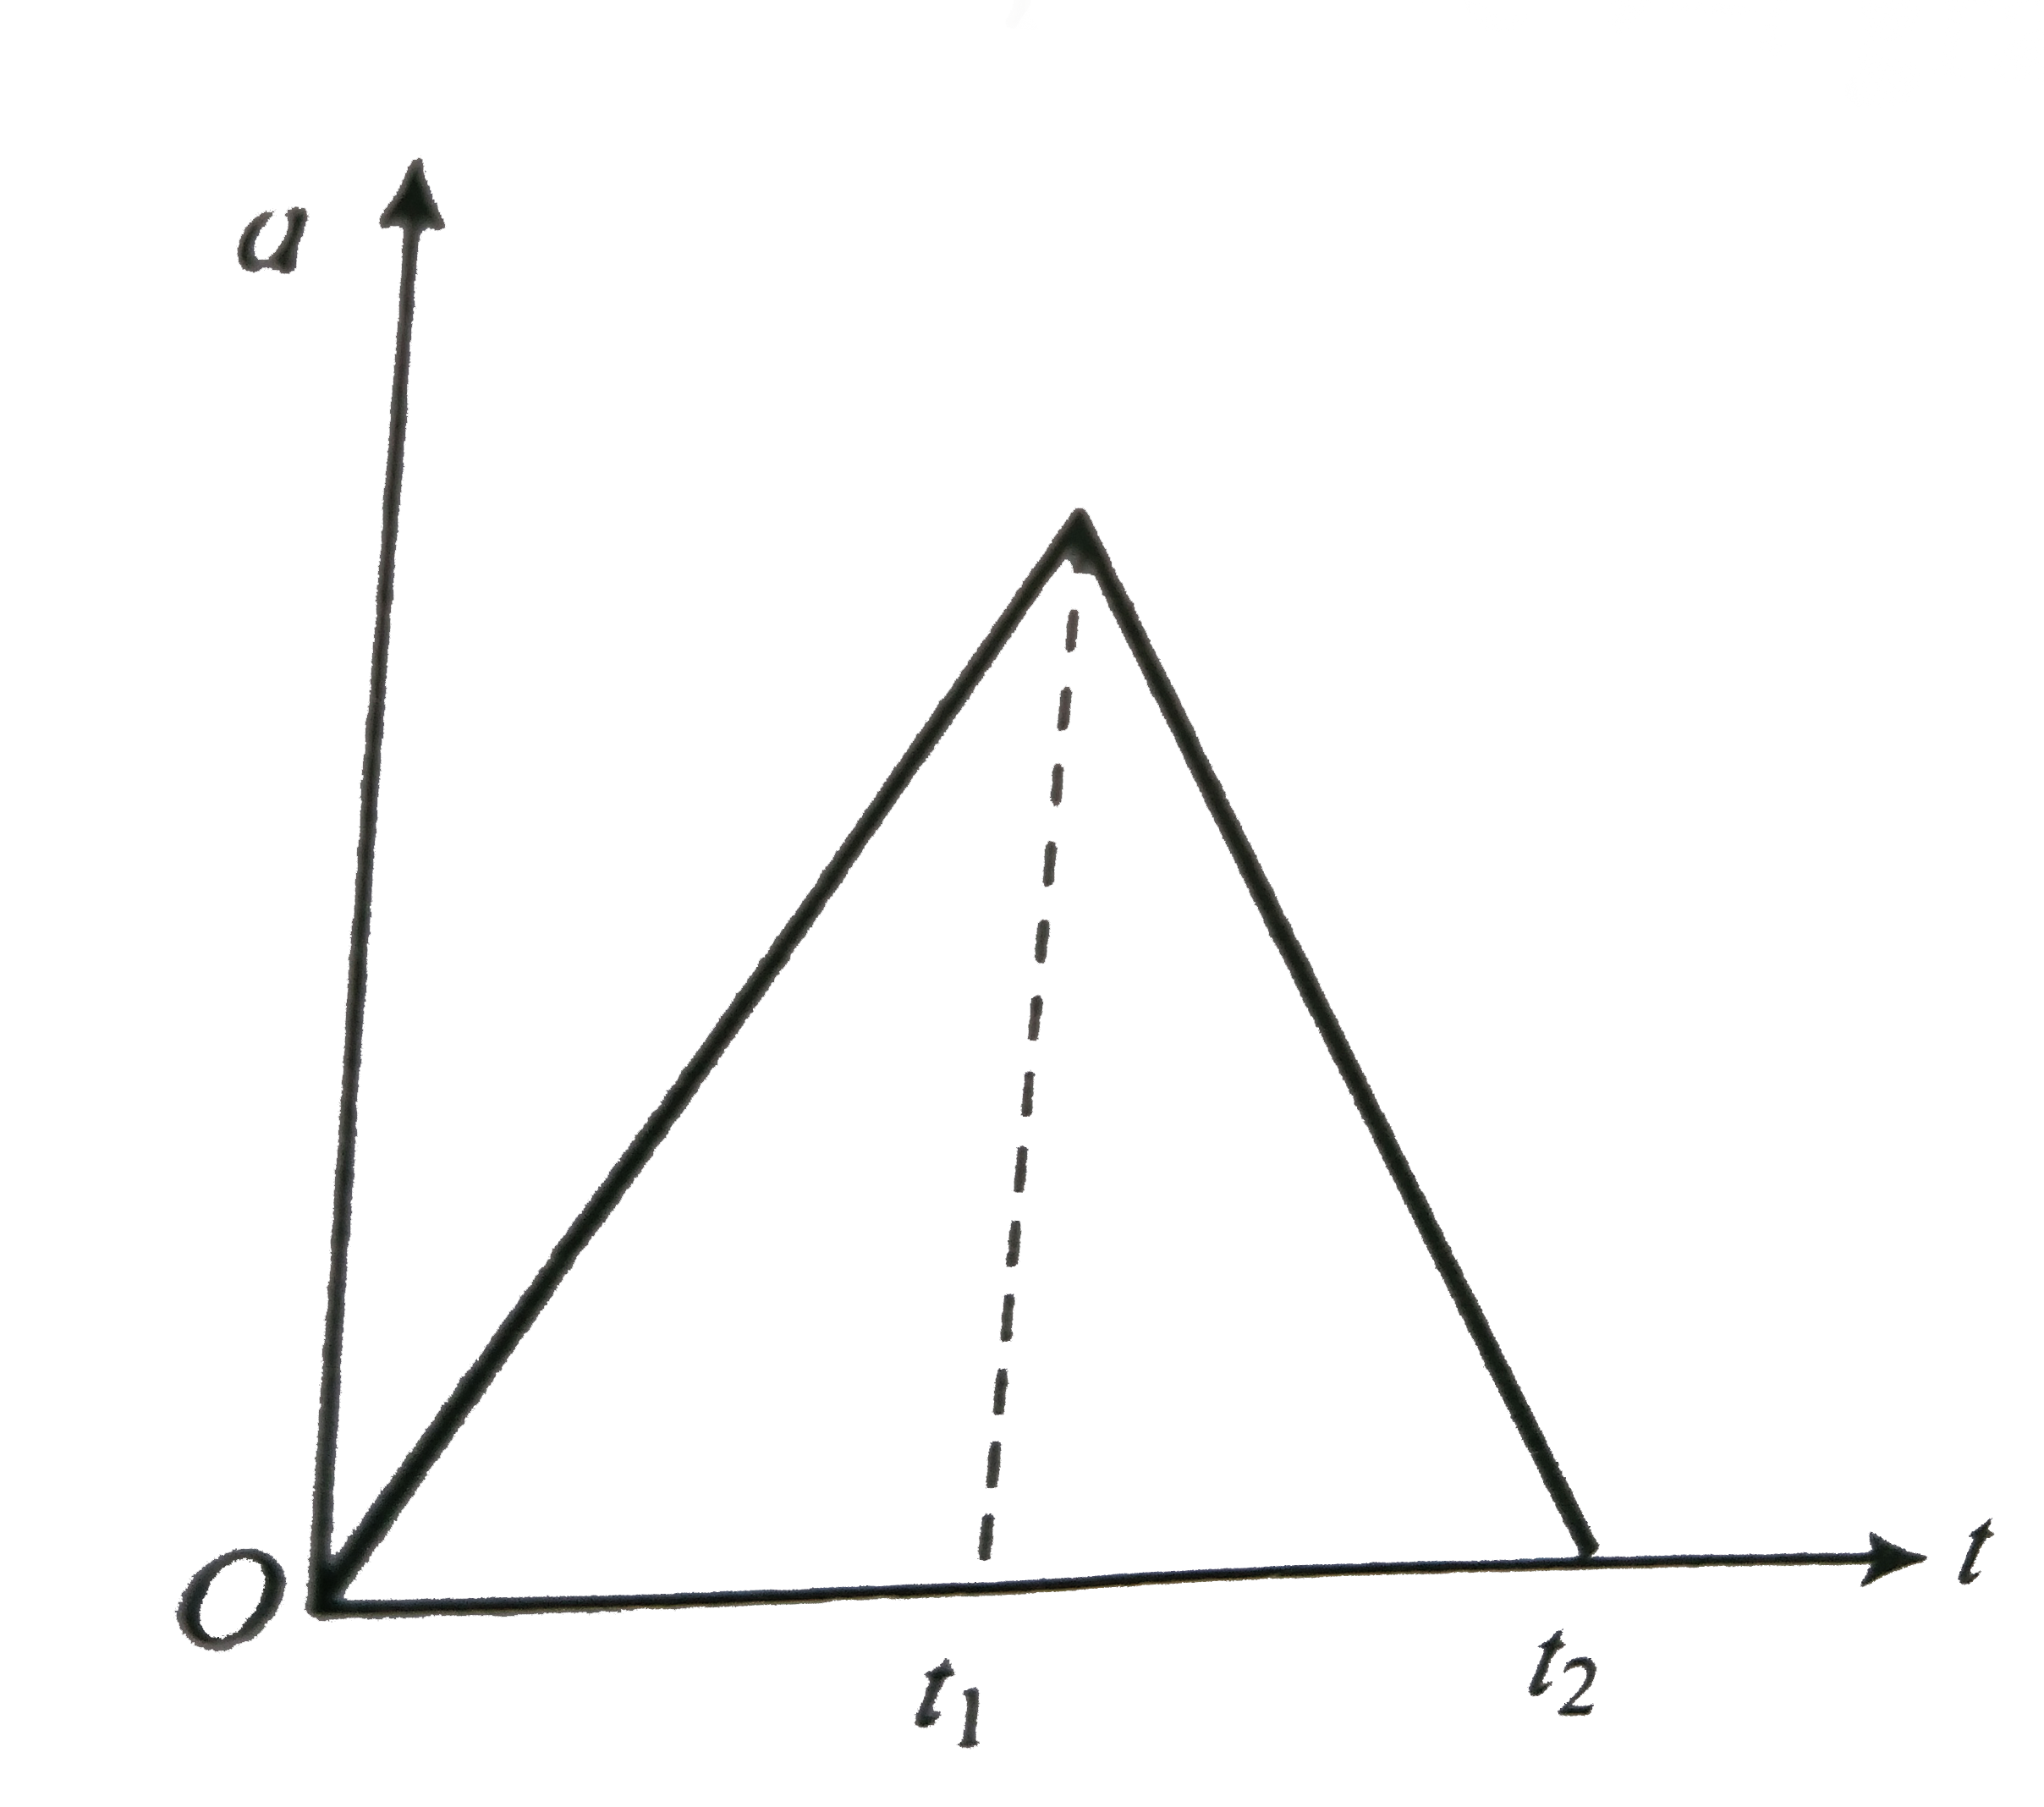 .
.
View SolutionAccleration vs time graph of a particle starting from rest is given. Find the displacement of particle in first 2 seconds.
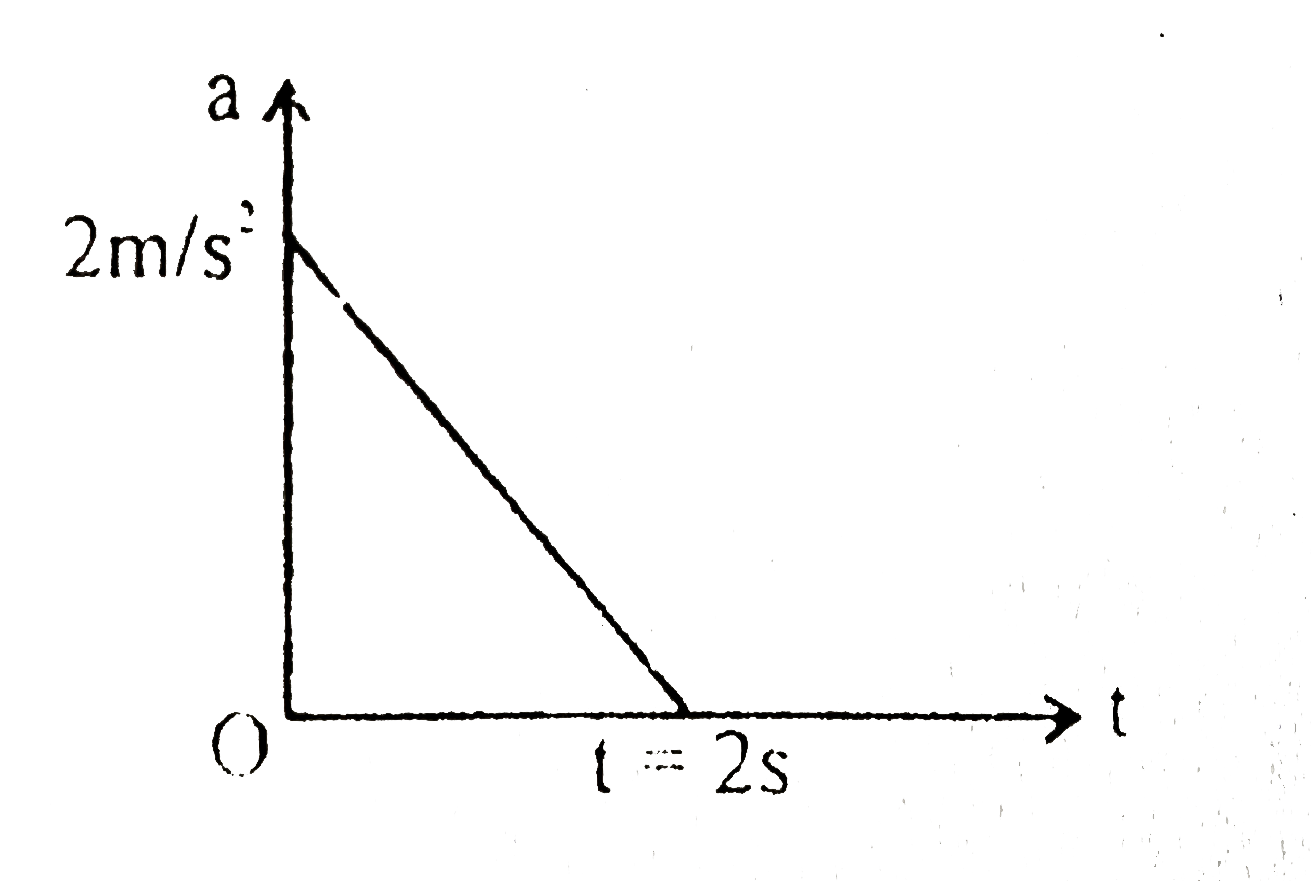
View Solution
