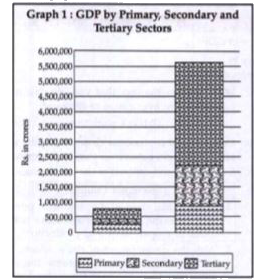
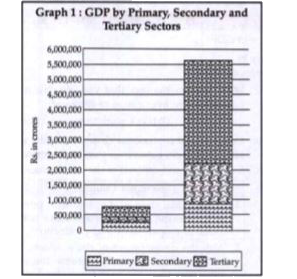
Answer the following questions by looking at the graph:
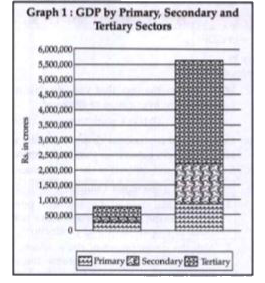
What was the GDP of India in 2013–14?
Text Solution
The total GDP was about Rs 5,500,000 crore.
|
Updated on:21/07/2023
Similar Questions
Knowledge Check
- Question 1 - Select One
The bar graph shows the number of males and females (in crores) in india during 1951-1991. Read the graph and answer the following questions
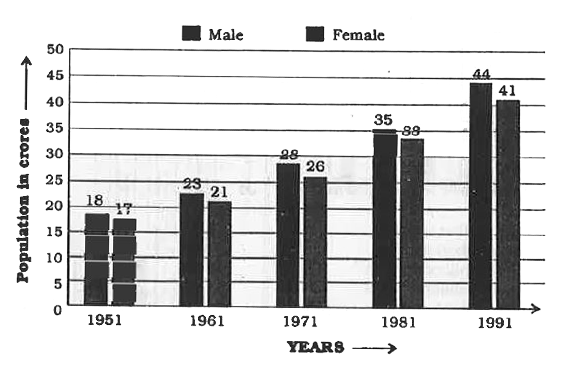
What is the ratio of the number of females in India in 1961 per thousand males to the number of males in India in 1991 per thousand females?A943:1077B1077:943C1073:913D861:1012 - Question 2 - Select One
The bar graph shows the number of males and females (in crores) in india during 1951-1991. Read the graph and answer the following questions
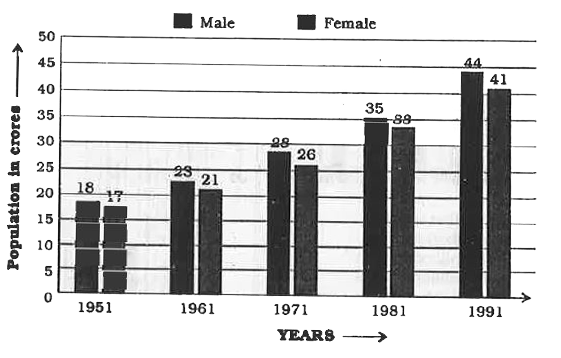
What was the approximate number of males in India in 1971 per thousands females ?A913B1075C1077D1175
Answer the following questions by looking at the graph:
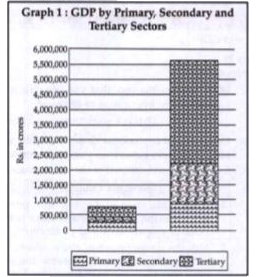
Can you say which sector has grown the most over 40 years?View SolutionAnswer the following questions below :
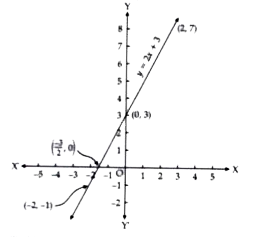
Name the shape of the graph.View SolutionAnswer the following questions below :
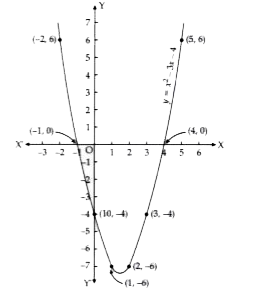 Name the shape of the graph . View Solution
Observe the graph given below and answer the following questions:
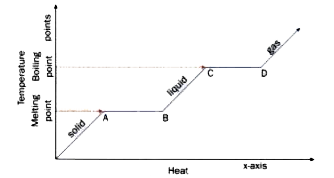
At two places, the graph is parallel to the x-axis. What does this mean?View SolutionWrite answers to the following questions :
What is the HCF of 14 and 126?View SolutionStudy the following graph and answer the question based on the graph.
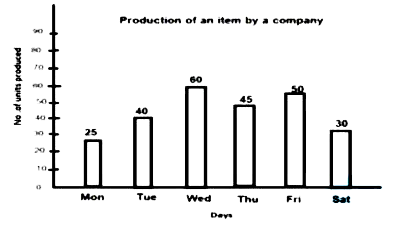
What was the percentage decline in the production from Friday to Saturday?View Solution


