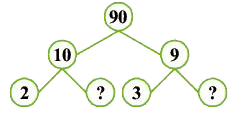
Write the missing numbers in the factor tree for 90?
 Solution in Telugu
The correct Answer is:(##ANDSCERTMATVIC03E03001_A01##)
Step by step video, text & image solution for Write the missing numbers in the factor tree for 90? by Maths experts to help you in doubts & scoring excellent marks in Class 6 exams.
Updated on:21/07/2023Topper's Solved these Questions
- PLAYING WITH NUMBERS BOOK - NCERT TELUGUCHAPTER - PLAYING WITH NUMBERS EXERCISE - EXERCISE - 3.4
5 Videos
- PLAYING WITH NUMBERS BOOK - NCERT TELUGUCHAPTER - PLAYING WITH NUMBERS EXERCISE - EXERCISE - 3.5
6 Videos
- PLAYING WITH NUMBERS BOOK - NCERT TELUGUCHAPTER - PLAYING WITH NUMBERS EXERCISE - EXERCISE - 3.2
12 Videos
- PLAYING WITH NUMBERABOOK - NCERT TELUGUCHAPTER - PLAYING WITH NUMBERAEXERCISE - EXERCISE
176 Videos
- PRACTICAL GEOMETRY BOOK - NCERT TELUGUCHAPTER - PRACTICAL GEOMETRY EXERCISE - Think, Discuss And Write
2 Videos
Similar Questions
Find the HCF of the following numbers by prime factorisation and continued division method ?
i. 18, 27, 36
ii. 106, 159, 265
iii. 10, 35, 40 iv. 32, 64, 96, 128
View SolutionFind the LCM of the following numbers by prime factorisation method.
i. 12 and 15
ii. 15 and 25 iii. 14 and 21
iv. 18 and 27 v. 48, 56 and 72 vi. 26, 14 and 91
View SolutionWrite all the factors of the following numbers.
i. 36 ii. 23 iii. 96 iv. 115
View SolutionIs 7224 divisible by 6? Why?
View SolutionHow would you check whether it is perpendicular or not? Note that it passes through ‘P’ as required.

View SolutionHow many lines of symmetry does the above figure have ?
View SolutionWhich of the following are correct chain isomers of butane ? (i)
View SolutionDetermine the point of symmetry of a regular hexagon.
View SolutionDtermine the images of the following figure about the given line :
View SolutionMatch the following Column A to Column B

View SolutionMatch the following Column A to Column B

View SolutionMatch the following Column A to Column B

View SolutionFind the area of the figure given below.

View SolutionThe area of the shaded part in the figure given below is ______.

View SolutionThe inequation represented by the graph given below is :
View SolutionThe inequation that best describes the graph given below is _________
View Solution
