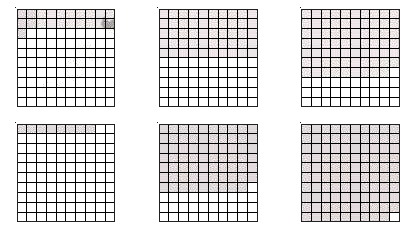
Given below are various grids of 100 squares. Each has a different number of squares coloured. In each case, write the coloured and white part in the form of a (1) Percentage, (2) Fraction and (3) Decimal.
 Solution in Telugu
Step by step video & image solution for Given below are various grids of 100 squares. Each has a different number of squares coloured. In each case, write the coloured and white part in the form of a (1) Percentage, (2) Fraction and (3) Decimal. by Maths experts to help you in doubts & scoring excellent marks in Class 7 exams.
Updated on:21/07/2023Topper's Solved these Questions
- RATIO - APPLICATIONSBOOK - NCERT TELUGUCHAPTER - RATIO - APPLICATIONSEXERCISE - Exercise 1
24 Videos
- RATIO - APPLICATIONSBOOK - NCERT TELUGUCHAPTER - RATIO - APPLICATIONSEXERCISE - Exercise 2
24 Videos
- RATIO - APPLICATIONSBOOK - NCERT TELUGUCHAPTER - RATIO - APPLICATIONSEXERCISE - Try This
14 Videos
- QUADRILATERALSBOOK - NCERT TELUGUCHAPTER - QUADRILATERALSEXERCISE - EXERCISE - 2 ( FILL IN THE BLANKS)
9 Videos
- RATIO- APPLICATIONSBOOK - NCERT TELUGUCHAPTER - RATIO- APPLICATIONSEXERCISE - EXERCISE
191 Videos
Similar Questions
What is the ratio of ₹100 and ₹10 ? Express your answer in simplest form.
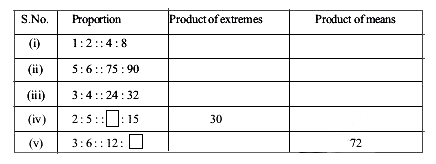
View SolutionFind the missing numbers in the following proportions in the table given below .

View SolutionThink of some real life situations in which you have to compare quantities in the form of a ratio.
View SolutionA parallelogram in which two adjacent sides are
equal is a ……….
View SolutionWhat is the ratio of ₹100 and ₹10 ? Express your answer in simplest form.
View SolutionDetermine the point of symmetry of a regular hexagon.
View SolutionDtermine the images of the following figure about the given line :
View SolutionMatch the following Column A to Column B

View SolutionMatch the following Column A to Column B

View SolutionMatch the following Column A to Column B

View SolutionFind the area of figure given below.

View SolutionFind the perimeter of the figure given below.

View SolutionFind the area of the figure given below.

View SolutionThe area of the shaded part in the figure given below is ______.

View SolutionThe inequation represented by the graph given below is :
View SolutionThe inequation that best describes the graph given below is _________
View Solution
