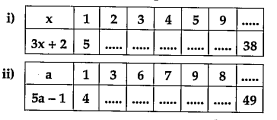
complete each table to generate the given functional relationship. Solution in Telugu
Step by step video & image solution for complete each table to generate the given functional relationship. by Maths experts to help you in doubts & scoring excellent marks in Class 6 exams.
Updated on:21/07/2023Topper's Solved these Questions
- INTRODUCTION TO ALGEBRABOOK - NCERT TELUGUCHAPTER - INTRODUCTION TO ALGEBRAEXERCISE - EXERCISE - 9.2
15 Videos
- INTRODUCTION TO ALGEBRABOOK - NCERT TELUGUCHAPTER - INTRODUCTION TO ALGEBRAEXERCISE - EXERCISE - 9.3
24 Videos
- INTRODUCTION TO ALGEBRABOOK - NCERT TELUGUCHAPTER - INTRODUCTION TO ALGEBRAEXERCISE - DO THIS
8 Videos
- INTEGERSBOOK - NCERT TELUGUCHAPTER - INTEGERSEXERCISE - EXERCISE - 6.4
36 Videos
- KNOWING OUR NUMBERSBOOK - NCERT TELUGUCHAPTER - KNOWING OUR NUMBERSEXERCISE - EXERCISE - 1.5
9 Videos
Similar Questions
Write the expressions for the statements: q is multiplied by 5.
View SolutionState which of the following are equations.
x−3=7
View SolutionFind the nth term in the following sequence: 3,6,9,12,….
View SolutionFind :
40 - (20)
View SolutionThe number of people who visited games village during commonwealth games in new Delhi for the first four days was recorded as 15,290,15,181, 14,235 and 10,578. Find the total number of people visited in these four days?
View SolutionDetermine the point of symmetry of a regular hexagon.
View SolutionDtermine the images of the following figure about the given line :
View SolutionMatch the following Column A to Column B

View SolutionMatch the following Column A to Column B

View SolutionMatch the following Column A to Column B

View SolutionFind the area of figure given below.

View SolutionFind the perimeter of the figure given below.

View SolutionFind the area of the figure given below.

View SolutionCalculate the volume of the given solid.
ltimg src="https://d10lpgp6xz60nq.cloudfront.net/physics_images/PS_MATH_VII_C06_E03_002_Q01.png" width="80%"gt
View SolutionThe area of the shaded part in the figure given below is ______.

View SolutionThe inequation represented by the graph given below is :
View Solution
