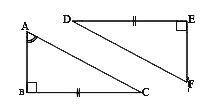
Explain, why ΔABC≅ΔFED
 Solution in Telugu
The correct Answer is:∠B=∠E;∠A=∠F by A.A.S. ΔABC≅ΔFED are congruent ; BC = ED
Step by step video, text & image solution for Explain, why Delta ABC ~= Delta FED by Maths experts to help you in doubts & scoring excellent marks in Class 7 exams.
Updated on:21/07/2023Topper's Solved these Questions
- CONGRUENCY OF TRIANGLESBOOK - NCERT TELUGUCHAPTER - CONGRUENCY OF TRIANGLESEXERCISE - Exerciese - 3
5 Videos
- AREA AND PERIMETERBOOK - NCERT TELUGUCHAPTER - AREA AND PERIMETEREXERCISE - EXERCISE - 6
5 Videos
- CONSTRUCTION OF TRIANGLESBOOK - NCERT TELUGUCHAPTER - CONSTRUCTION OF TRIANGLESEXERCISE - EXERCISE -5
5 Videos
Similar Questions
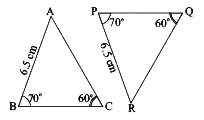
In following pairs of triangles, find the pairs which are congruent? Also, write the criterion of congruence.

View SolutionA path 2.5 m wide is running around a square field whose side is 45m. determine the area of the path.
View SolutionConstruct △ ABC in which AB = 4.5 cm, AC = 4.5 cm and ∠B=50∘. Check whether you get two triangles.
View SolutionHow many lines of symmetry does the above figure have ?
View SolutionWhich of the following are correct chain isomers of butane ? (i)
View SolutionDetermine the point of symmetry of a regular hexagon.
View SolutionDtermine the images of the following figure about the given line :
View SolutionIn the following figure, AB and BC are equidistant from the centre 'O' of the Show that
(a) ABC is an isosceles triangle.
(b) OB bisects angle ABC.
ltimg src="https://d10lpgp6xz60nq.cloudfront.net/physics_images/PS_MATH_X_C13_E02_006_Q01.png" width="80%"gt
View SolutionMatch the following Column A to Column B

View SolutionMatch the following Column A to Column B

View SolutionMatch the following Column A to Column B

View SolutionFind the area of the figure given below.

View SolutionThe area of the shaded part in the figure given below is ______.

View SolutionThe inequation represented by the graph given below is :
View SolutionThe inequation that best describes the graph given below is _________
View SolutionThe inequation that best describes the following graph is _________
View Solution
