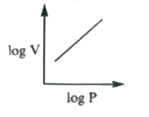
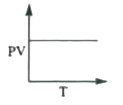
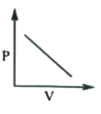
Which among the following indicates change in the chemical composition due to dissociation


The correct Answer is:C
To solve the question regarding which graph indicates a change in the chemical composition due to dissociation, we can follow these steps:
1. Understand Dissociation:
- Dissociation refers to the process where a compound breaks down into two or more simpler substances or ions. For example, a compound XY might dissociate into X and Y.
2. Recognize the Effect on Moles:
- When a compound dissociates, the number of moles of the products increases. For instance, if one mole of XY dissociates into two moles (X and Y), the total number of moles increases from 1 to 2.
3. Apply the Ideal Gas Law:
- The ideal gas equation is given by PV=nRT, where:
- P = pressure
- V = volume
- n = number of moles
- R = ideal gas constant
- T = temperature
- If the number of moles n increases due to dissociation, then PV must also change to maintain the equality.
4. Analyze the Graphs:
- We are given four graphs to analyze. We need to identify which graph shows a change in PV/T that corresponds with an increase in the number of moles due to dissociation.
- Initially, PV/T is constant, but as dissociation occurs and the number of moles increases, PV/T should also increase.
5. Identify the Correct Graph:
- Look for a graph where PV/T increases initially with dissociation and then stabilizes once all reactants have dissociated. This behavior indicates a change in chemical composition due to dissociation.
6. Conclusion:
- Based on the analysis, the correct graph that indicates a change in chemical composition due to dissociation is Option C.
- Dissociation refers to the process where a compound breaks down into two or more simpler substances or ions. For example, a compound XY might dissociate into X and Y.
- When a compound dissociates, the number of moles of the products increases. For instance, if one mole of XY dissociates into two moles (X and Y), the total number of moles increases from 1 to 2.
- The ideal gas equation is given by PV=nRT, where:
- P = pressure
- V = volume
- n = number of moles
- R = ideal gas constant
- T = temperature
- If the number of moles n increases due to dissociation, then PV must also change to maintain the equality.
- We are given four graphs to analyze. We need to identify which graph shows a change in PV/T that corresponds with an increase in the number of moles due to dissociation.
- Initially, PV/T is constant, but as dissociation occurs and the number of moles increases, PV/T should also increase.
- Look for a graph where PV/T increases initially with dissociation and then stabilizes once all reactants have dissociated. This behavior indicates a change in chemical composition due to dissociation.
- Based on the analysis, the correct graph that indicates a change in chemical composition due to dissociation is Option C.
Similar Questions
Knowledge Check
Which of the following is a chemical change ?
Acurdling of milkBevaporation of waterCmelting of ice creamDdeflating ballonWhich of the following is a chemical change ?
AA. Souring of milkBB. Stretching of rubberCC. Preparation of starch pasteDD. Melting of wax.Among the following which one causes more indoor chemical pollution ?
ABurning coalBBurning cooking gasCBurning mosquito coilDRoom spray
What is the chemical composition of calgon ?
View SolutionWhich of the following changes are the chemical changes?

View SolutionWhich of the following is not a chemical change?
View SolutionA substance with fixed chemical composition.
View SolutionAmong the following which one causes more indoor chemical pollution ?
View Solution
