By repeating the same measurement several times, the errors that can be reduced are
determinate errors
instrumental erros
random errors
Systematic errors
The correct Answer is:D
To solve the question, we need to understand the types of errors that can occur in measurements and how repeating measurements can affect them.
1. Identify the Types of Errors:
- In measurements, there are two main types of errors: systematic errors and random errors.
- Systematic errors are consistent and repeatable inaccuracies that occur due to a flaw in the measurement system.
- Random errors are caused by unpredictable fluctuations in the measurement process.
2. Understand Random Errors:
- Random errors can arise from various factors such as environmental changes, limitations of the measuring instrument, or human error during the measurement process.
- These errors are not consistent and can vary from one measurement to another.
3. Effect of Repeating Measurements:
- When the same measurement is repeated multiple times, the random errors tend to average out.
- By taking multiple readings, you can calculate an average value, which helps in minimizing the impact of random fluctuations.
4. Conclusion:
- Therefore, by repeating the same measurement several times, the errors that can be reduced are random errors.
- The correct option in this context is option 3, which states that random errors can be minimized through repeated measurements.
Final Answer:
By repeating the same measurement several times, the errors that can be reduced are random errors.
- In measurements, there are two main types of errors: systematic errors and random errors.
- Systematic errors are consistent and repeatable inaccuracies that occur due to a flaw in the measurement system.
- Random errors are caused by unpredictable fluctuations in the measurement process.
- Random errors can arise from various factors such as environmental changes, limitations of the measuring instrument, or human error during the measurement process.
- These errors are not consistent and can vary from one measurement to another.
- When the same measurement is repeated multiple times, the random errors tend to average out.
- By taking multiple readings, you can calculate an average value, which helps in minimizing the impact of random fluctuations.
- Therefore, by repeating the same measurement several times, the errors that can be reduced are random errors.
- The correct option in this context is option 3, which states that random errors can be minimized through repeated measurements.
By repeating the same measurement several times, the errors that can be reduced are random errors.
Topper's Solved these Questions
- UNITS AND MEASUREMENTBOOK - AAKASH SERIESCHAPTER - UNITS AND MEASUREMENTEXERCISE - EXERCISE - II
61 Videos
- UNITS AND MEASUREMENTBOOK - AAKASH SERIESCHAPTER - UNITS AND MEASUREMENTEXERCISE - PRACTICE EXERCISE
45 Videos
- UNITS AND MEASUREMENTBOOK - AAKASH SERIESCHAPTER - UNITS AND MEASUREMENTEXERCISE - PRACTICE EXERCISE
45 Videos
- SEMICONDUCTOR DEVICESBOOK - AAKASH SERIESCHAPTER - SEMICONDUCTOR DEVICESEXERCISE - EXERCISE - III
3 Videos
- UNITS AND MEASUREMENTSBOOK - AAKASH SERIESCHAPTER - UNITS AND MEASUREMENTSEXERCISE - EXERCISE -3
66 Videos
Similar Questions
A student performs exeriment with simple pendulum and measures time for 10 vibrations. If the measures the time for 100 vibrations, the error in measurement of time period will be reduced by a factor of......
View SolutionIn the experiment of verification of Ohm's law the error in the current measurement is 1%, while that in the voltage measurement is 2%. The error in the resistance has a maximum value of
View Solution
Knowledge Check
The energy of a system as a function of time t is given as E(t)=A2exp(−αt), α=0.2s−1. The measurement of A has an error of 1.25%. If the error In the measurement of time is 1.50%, the percentage error in the value of E(t) at t = 5 s is
A0.02B0.04C0.03D0.05
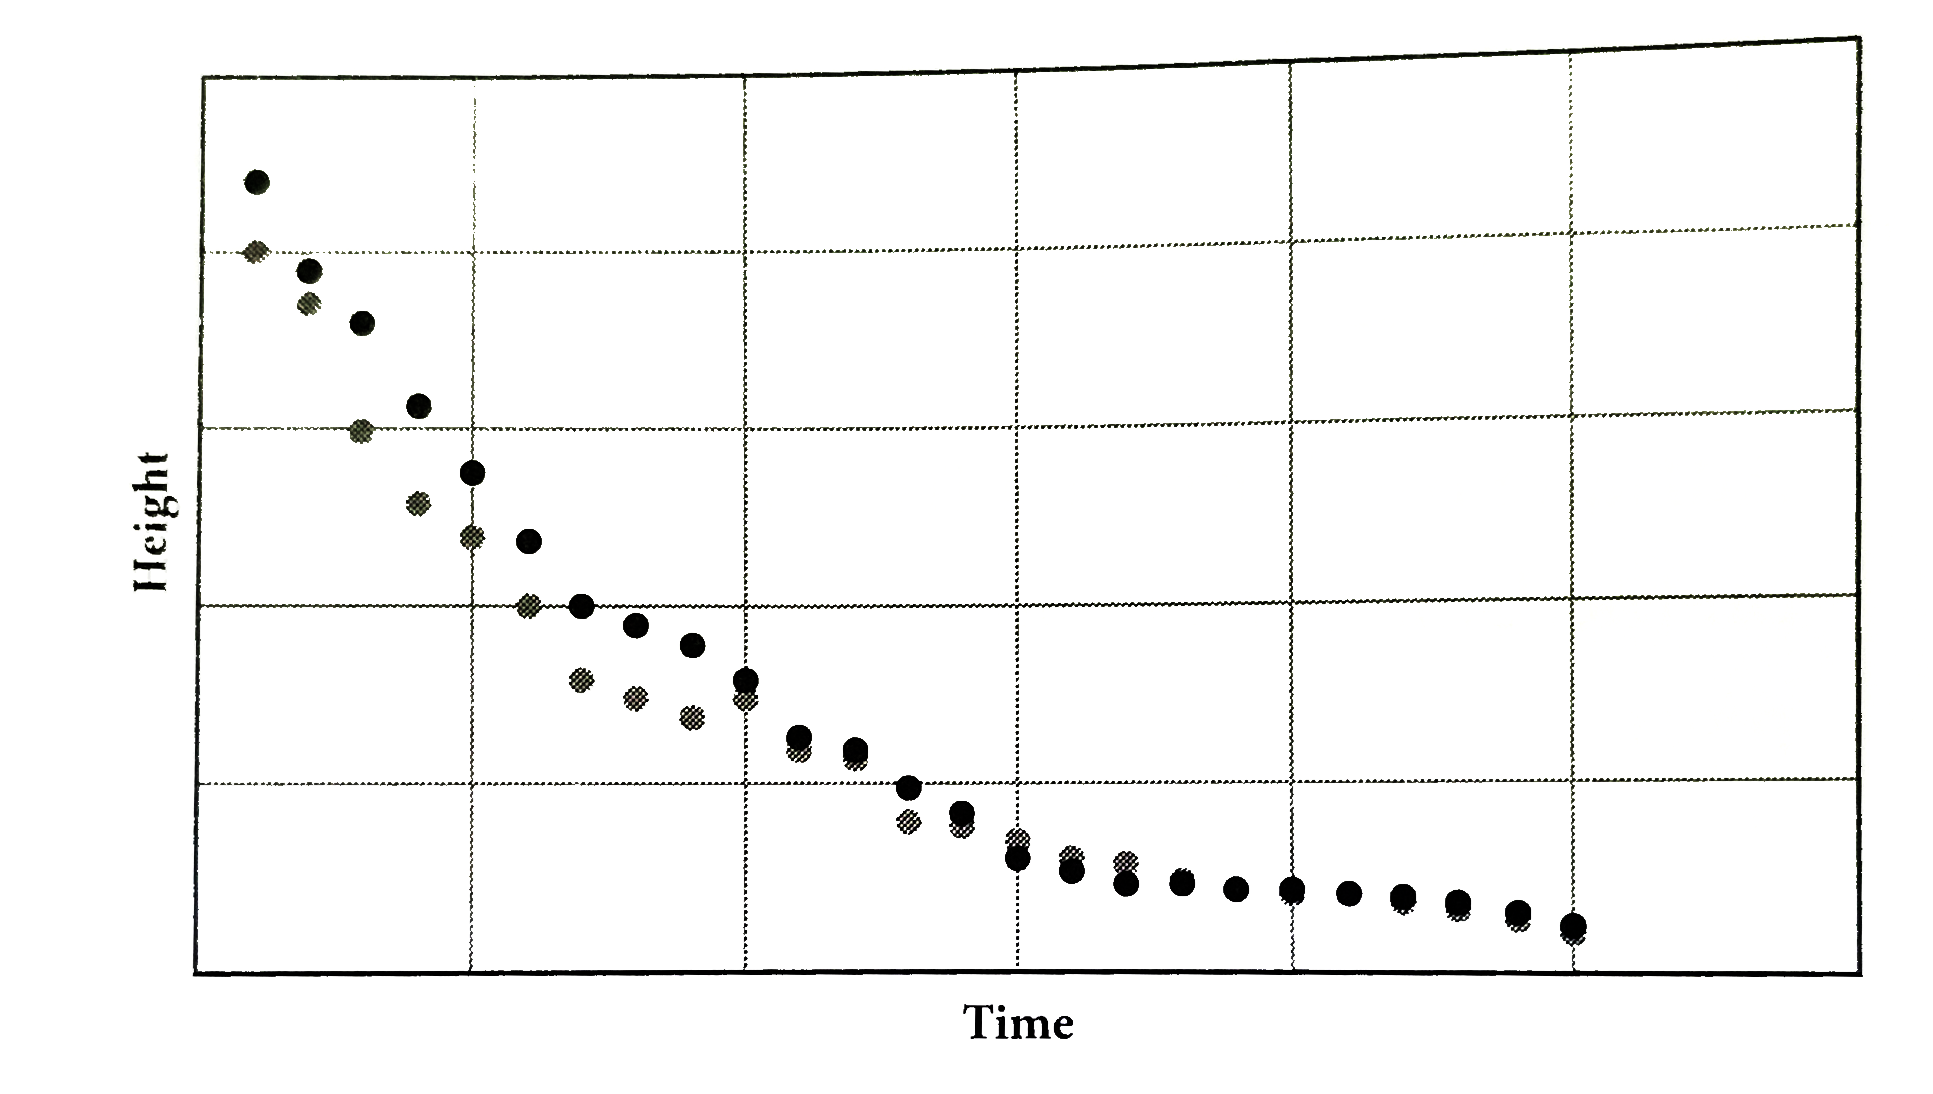
A drain at the bottom of a cylondrical water tank is opened and the height of the water is measured at regular time intervals. The tank is refilled and the process is then repeated. The scatterplot above shows the measured height on the y-axis and time on the x-axis for the trials. Which of the following conclusions can be drawn from the observations in the scatterplot?AWater flows out of the drain at a constant rate.BThe flow rate from the tank decreases as the height of the water in the tank decreases.CThe drain is inefficinetly designed.DThe is no relationship between the height of the water in the tank and time.
The arithmetic mean of several measurements is called
View SolutionThe kinetic energy of a particle depends on the square of speed of the particle. If error in measurement of speed is 30%, the error in the measurement of kinetic energy will be
View SolutionThe energy of a system as a function of time t is given as E(t)=A2exp(−αt), α=0.2s−1. The measurement of A has an error of 1.25%. If the error In the measurement of time is 1.50%, the percentage error in the value of E(t) at t = 5 s is
View SolutionFor a vibration magnetometer, the time period of suspended bar magnet can be reduced by -
View SolutionThe pressure on a circular plate is measured by measuring the force on the plate and the radius of the plate. If the errors in measurement of force and radius are 5% and 3% , respectively , then the percentage of error in the measurement of pressure is
View SolutionThe lengths of sides of a cuboid are a, 2a and 3a. If the relative percentage error in the measurement of a is 1%, then what is the relative percentage error in the measurement of the volume of the cuboid.
View Solution
