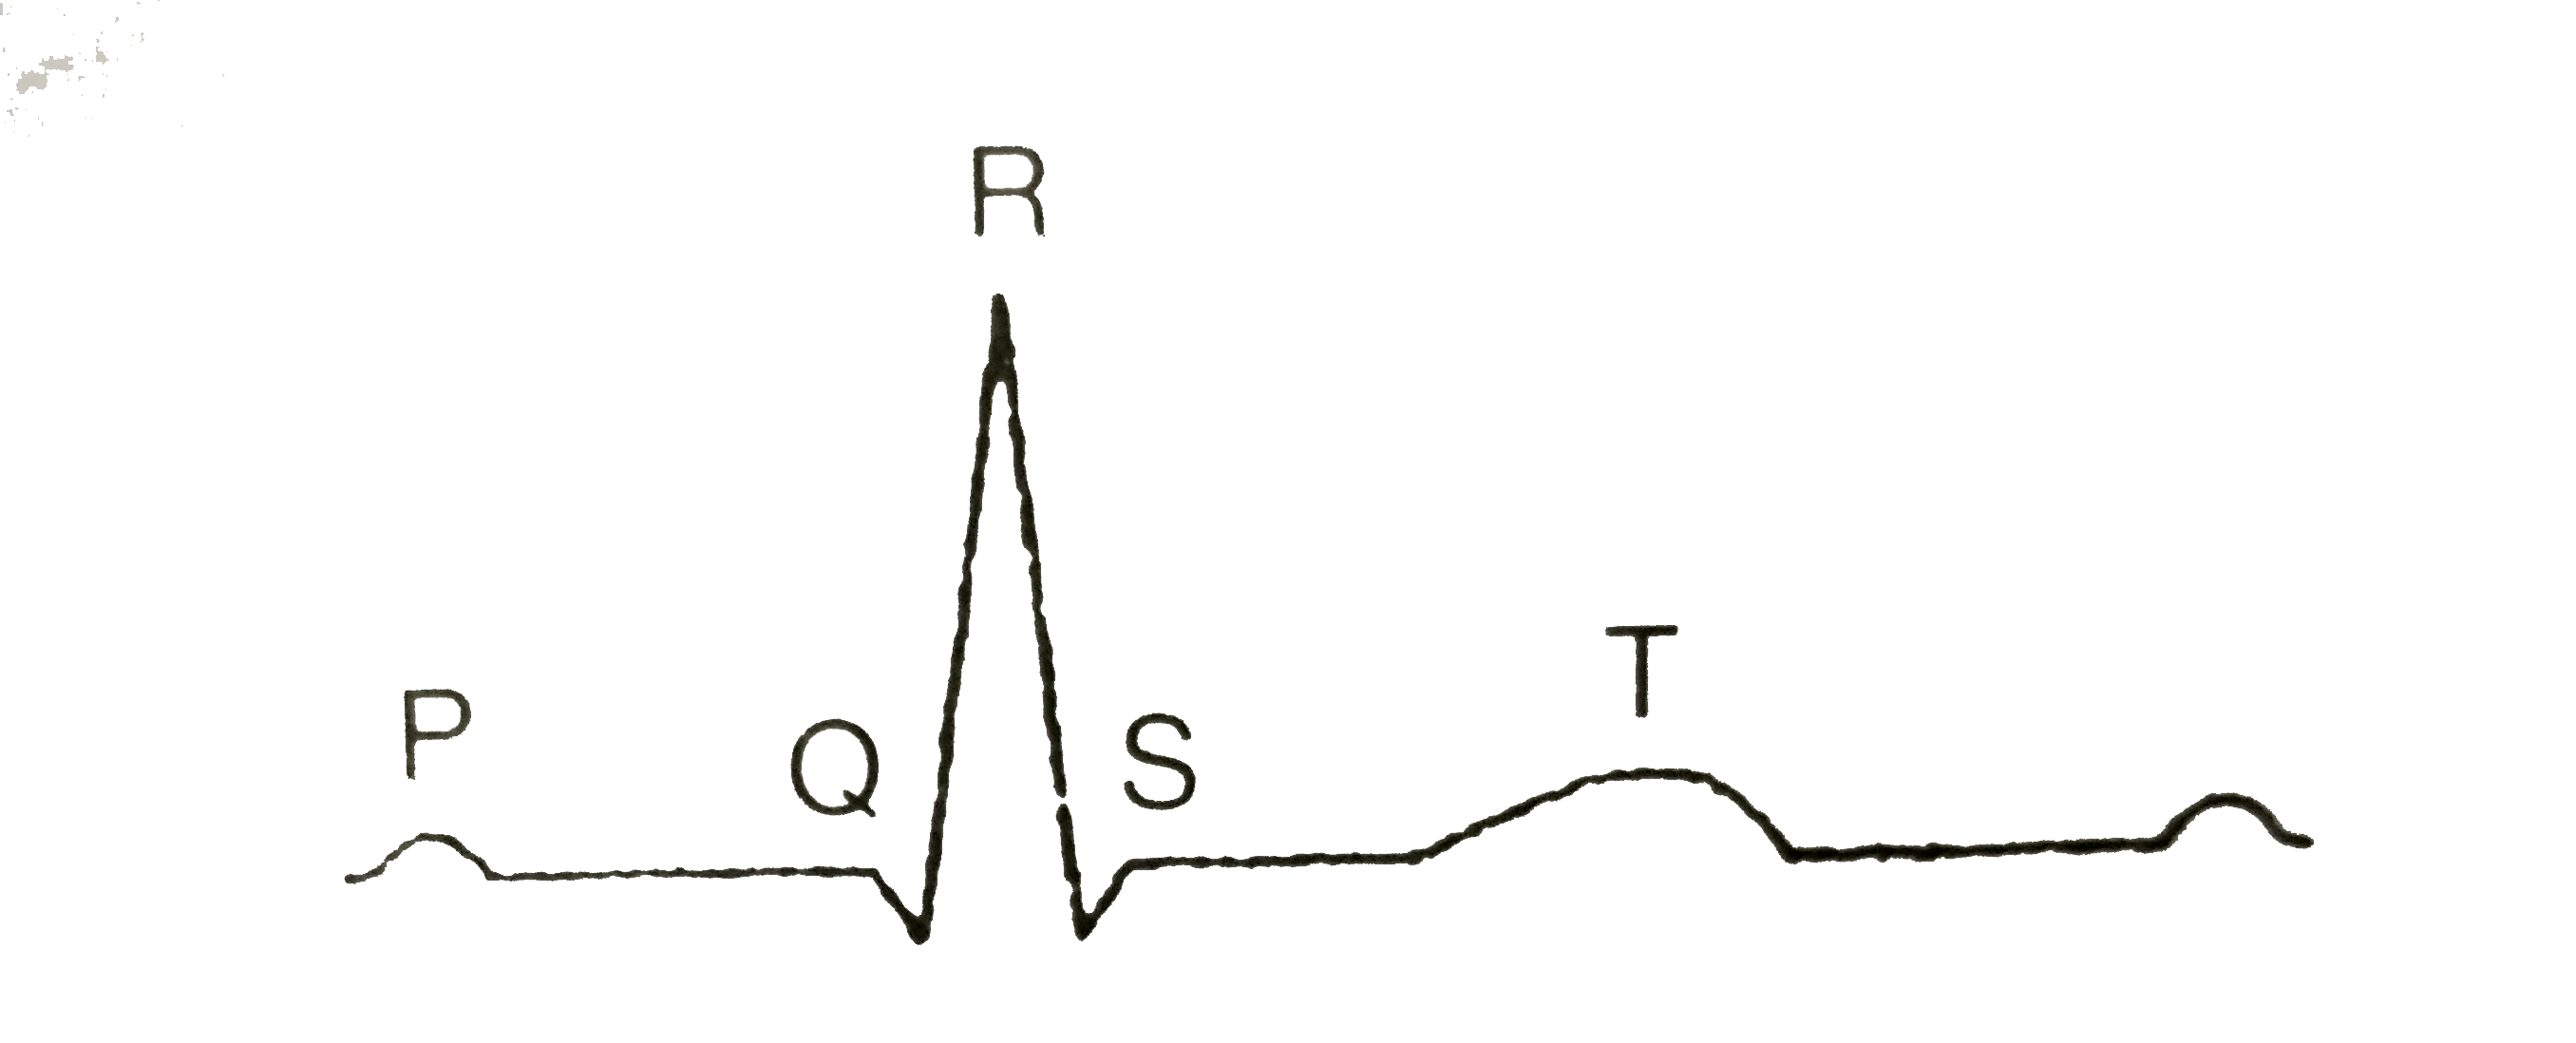
The diagram given here is the standard ECG of a normal person.The P-wave represents the
A
The beginning of the systole
B
End of systole
C
Contraction of both the artia
D
Initiation of the ventricular contraction
Video Solution
Text Solution
The correct Answer is:A
|
Answer
Step by step video & image solution for The diagram given here is the standard ECG of a normal person.The P-wave represents the by Biology experts to help you in doubts & scoring excellent marks in Class 12 exams.
Updated on:21/07/2023Topper's Solved these Questions
- BODY FLUIDS AND CIRCULATIONBOOK - AAKASH SERIESCHAPTER - BODY FLUIDS AND CIRCULATIONEXERCISE - Exercise -II (Disorders of Circulatory System)
8 Videos
- BIOTECHNOLOGY AND ITS APPLICATIONSBOOK - AAKASH SERIESCHAPTER - BIOTECHNOLOGY AND ITS APPLICATIONSEXERCISE - Exercise - III (Previous AIPMT/NEET Questions )
19 Videos
- BREATHING AND EXCHANGE OF GASES BOOK - AAKASH SERIESCHAPTER - BREATHING AND EXCHANGE OF GASES EXERCISE - EXERCISE-III (Previous AIPMT/NEET Questions)
21 Videos
Similar Questions
Knowledge Check
The diagram given here is the representation of
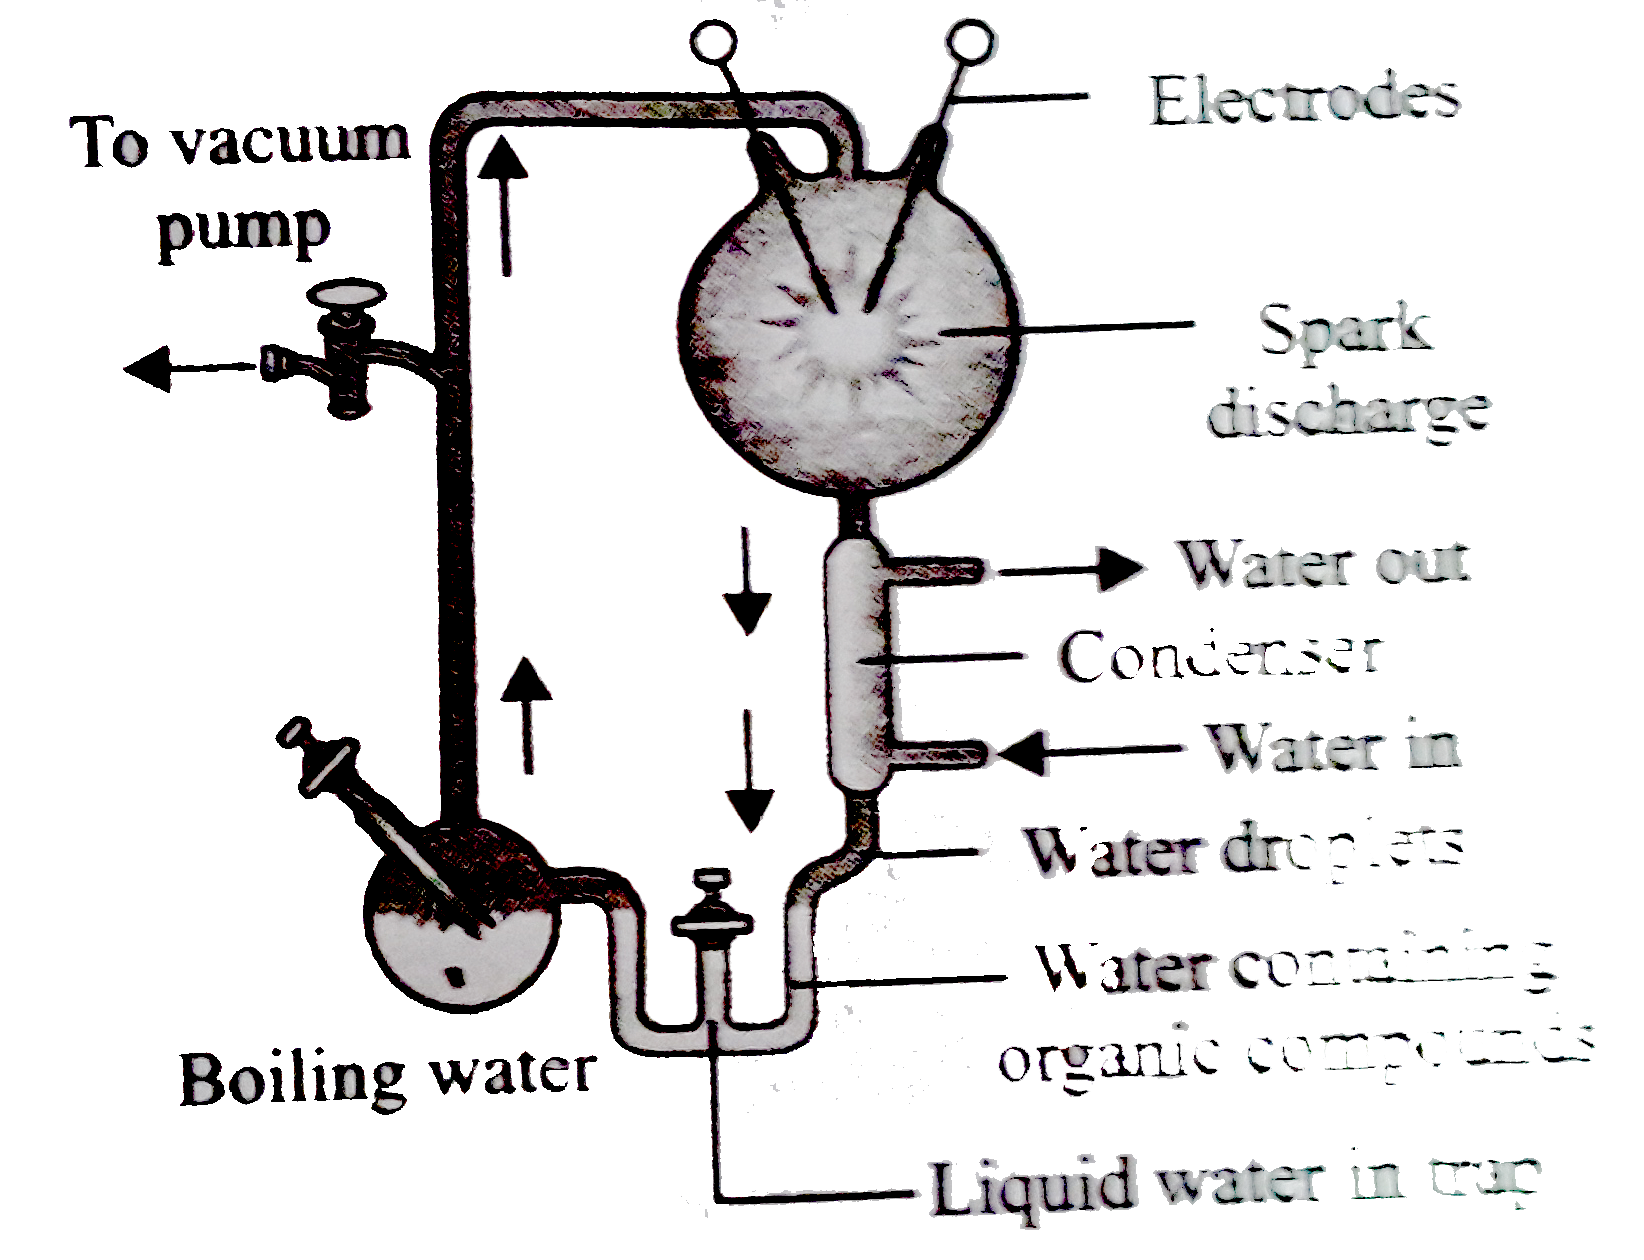 AMiller's experimentBRedi's experimentCLouis pasteur's experimentDSpallanzani's experiment
Study the diagram given below and answer the questions that follow:
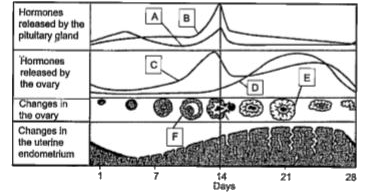
The alphabet 'A' represents ______ hormone.AOestrogenBProgesteroneCFSHDLH
The diagram given below represents
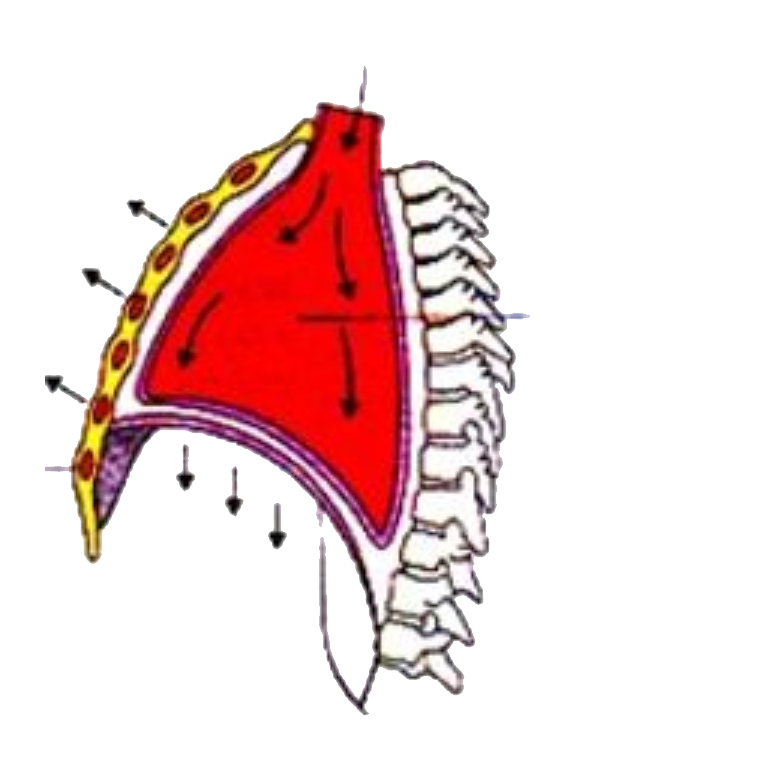
View SolutionThe given diagram represents
View SolutionIn ECG, what does T wave represent?
View Solution'T' wave in an ECG represents
View SolutionT wave in a standard ECG represents
View SolutionFor the diagram given for an ideal gas, out of the following which one correctly represent the diagram?
View Solution

