Enzymes isolated from organisms which line in extreme high temperatures (eg , hot vents and sulphur springs) show catalytic activity in a 93 94 98 range of
40−60∘C
60−80∘C
80−90∘C
40−45∘C
The correct Answer is:C
Step-by-Step Solution:
1. Understanding the Question: The question asks about enzymes isolated from organisms that live in extreme high temperatures, specifically in the range of 93 to 98 degrees Celsius. These enzymes are typically referred to as "thermostable" or "thermophilic" enzymes.
2. Identifying the Source of Enzymes: Organisms that thrive in extreme temperatures are often found in environments such as hot vents and sulfur springs. These organisms are usually extremophiles, particularly thermophiles, which can withstand high temperatures.
3. Characteristics of Thermophilic Enzymes: Enzymes from thermophiles are known for their stability and activity at high temperatures. This is due to their unique structural adaptations that prevent denaturation, which is the process where proteins lose their functional shape.
4. Applications of Thermophilic Enzymes: These enzymes are used in various industrial applications, including biotechnology, food processing, and biofuels, because they can function effectively at high temperatures where other enzymes would denature.
5. Conclusion: The catalytic activity of these enzymes in the range of 93 to 98 degrees Celsius makes them valuable for processes that require high-temperature conditions.
Final Answer: Enzymes isolated from organisms that live in extreme high temperatures show catalytic activity in the range of 93 to 98 degrees Celsius.
---
Topper's Solved these Questions
- BIOMOLECULESBOOK - AAKASH SERIESCHAPTER - BIOMOLECULESEXERCISE - EXERCISE - I (Enzymes -Introduction)
13 Videos
- BIOMOLECULESBOOK - AAKASH SERIESCHAPTER - BIOMOLECULESEXERCISE - EXERCISE - I (Chemical reactions)
4 Videos
- BIOLOGICAL CLASSIFICATIONBOOK - AAKASH SERIESCHAPTER - BIOLOGICAL CLASSIFICATIONEXERCISE - EXERCISE-III (Previous AIPMT/NEET Question)
37 Videos
- CELL CYCLE AND CELL DIVISIONBOOK - AAKASH SERIESCHAPTER - CELL CYCLE AND CELL DIVISIONEXERCISE - Exercise-III
18 Videos
Similar Questions
The gases obey the different gas laws only theoretically. Practically all of them show some deviation from these laws. These are called real gases. The deviation are maximum under high pressure and at low temperature. These are comparatively small when the conditions are reversed. It has been found that the easily liquefiable gases show more deviations from the ideal gas behaviour as compared to the gases which are liquified with difficulty.
The temperature at which the real gases obey the ideal gas laws over a wide range of pressure is called
View SolutionSketch shows the plot of Z v/s P for a hypothetical gas for one mole at three distint temperature.
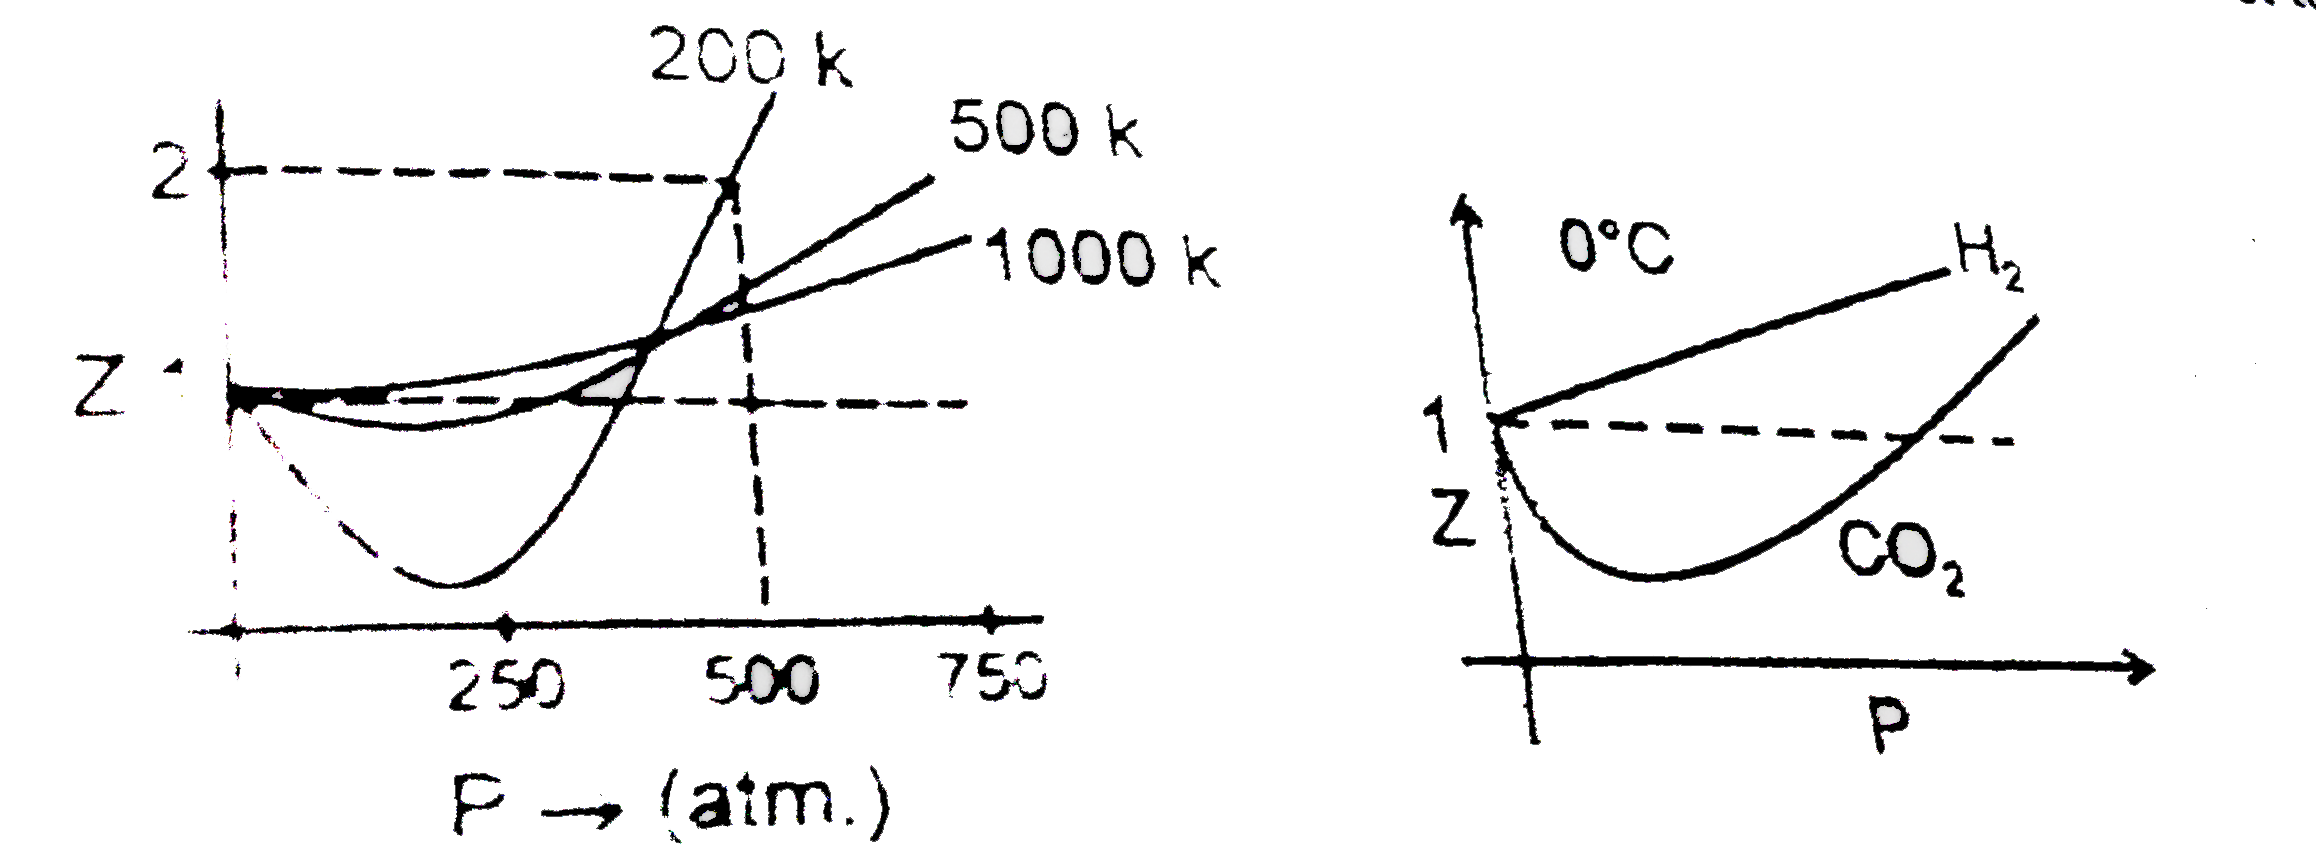
Boyle's temperature is the temperature at which gas shows ideal behaviour over a pressure range in the low pressure region.Boyle's temperature (Tb)=aRb.If a plot is obtained at temperature well below Boyle's temperature then the curve will show negative deviation, in low pressure region and positive deviation in the high pressure region. Near critical temperature the curve is more likely as CO2 and the temperature well above critical temperature curve is more like H2 at 0∘C as shown above.At high pressure suppose all the constant temperature curve varies linearly with pressure according to the following equation : Z=1+PbRT (R=2calmol−1K−1)
For 500 K plot value of Z changes from 2 to 2.2 if pressure is varied from 1000 atm to 1200 atm (high pressure ) then the value of bRT will be
View Solution
Knowledge Check
Dark Snow
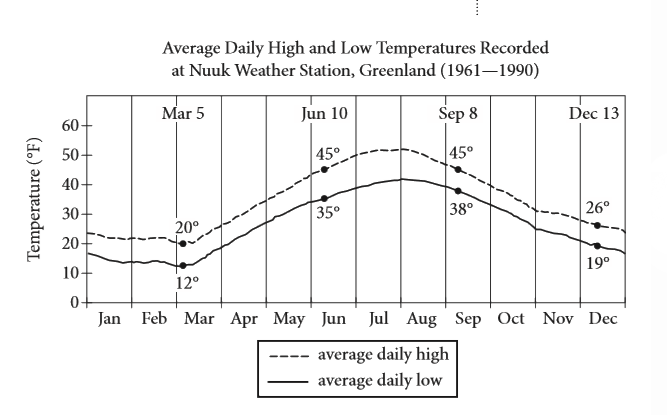
Most of Greenland’s interior is covered by a thick layer of ice and compressed snow known as the Greenland Ice Sheet. The size of the ice sheet fluctuates seasonally: in summer, average daily high temperatures in Greenland can rise to slightly above 50 degrees Fahrenheit, partially melting the ice, in the winter, the sheet thickens as additional snow falls, and average daily low temperatures can drop to (12) as low as 20 degrees–––––––––––––––––––––.
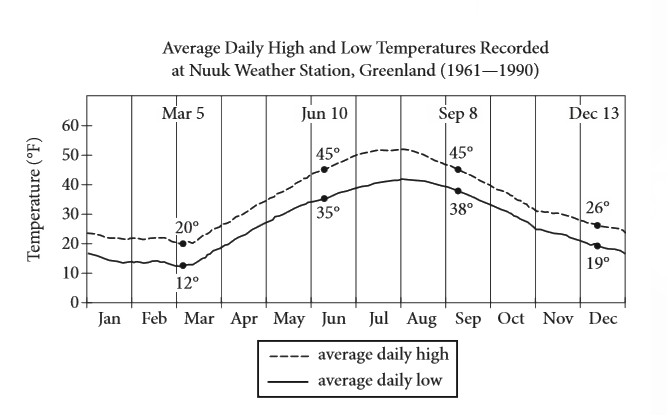
Typically, the ice sheet begins to show evidence of thawing in late (13)summer. This follows––––––––––––––––––––––– several weeks of higher temperatures. 14 For example––––––––––––––, in the summer of 2012, virtually the entire Greenland Ice Sheet underwent thawing at or near its surface by mid-July, the earliest date on record. Most scientists looking for the causes of the Great Melt of 2012 have focused exclusively on rising temperatures. The summer of 2012 was the warmest in 170 years, records show. But Jason (15) Box, an associate––––––––––––––––––– professor of geology at Ohio State believes that another factor added to the early (16) (thaw), the “dark snow” problem.
According to Box, a leading Greenland expert, tundra fires in 2012 from as far away as North America produced great amounts of soot, some (17) of it–––––drifted over Greenland in giant plumes of smoke and then (18) fell–––– as particles onto the ice sheet. Scientists have long known that soot particles facilitate melting by darkening snow and ice, limiting (19) it’s–––– ability to reflect the Sun’s rays. As Box explains, “Soot is an extremely powerful light absorber. It settles over the ice and captures the Sun’s heat.” The result is a self-reinforcing cycle. As the ice melts, the land and water under the ice become exposed, and since land and water are darker than snow, the surface absorbs even more heat, which (20) is related to the rising temperatures–––––––––––––––––––––––––––––––––––––––.
[1] Box’s research is important because the fires of 2012 may not be a one-time phenomenon. [2] According to scientists, rising Arctic temperatures are making northern latitudes greener and thus more fire prone.[3] The pattern Box observed in 2012 may repeat (21) itself again––––––––––––, with harmful effects on the Arctic ecosystem. [4] Box is currently organizing an expedition to gather this crucial information. [5] The next step for Box and his team is to travel to Greenland to perform direct sampling of the ice in order to determine just how much the soot is contributing to the melting of the ice sheet. [6] Members of the public will be able to track his team’s progress—and even help fund the expedition—through a website Box has created. (22)ANO CHANGEBthaw, and it wasCthaw:Dthaw: beingDark Snow
Most of Greenland’s interior is covered by a thick layer of ice and compressed snow known as the Greenland Ice Sheet. The size of the ice sheet fluctuates seasonally: in summer, average daily high temperatures in Greenland can rise to slightly above 50 degrees Fahrenheit, partially melting the ice, in the winter, the sheet thickens as additional snow falls, and average daily low temperatures can drop to (12) as low as 20 degrees–––––––––––––––––––––.
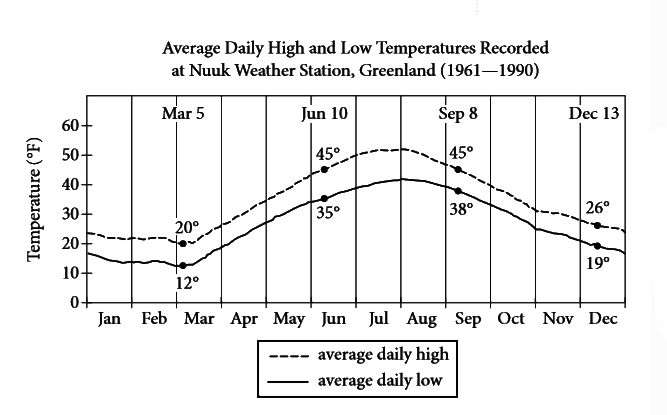
Typically, the ice sheet begins to show evidence of thawing in late (13)summer. This follows––––––––––––––––––––––– several weeks of higher temperatures. 14 For example––––––––––––––, in the summer of 2012, virtually the entire Greenland Ice Sheet underwent thawing at or near its surface by mid-July, the earliest date on record. Most scientists looking for the causes of the Great Melt of 2012 have focused exclusively on rising temperatures. The summer of 2012 was the warmest in 170 years, records show. But Jason (15) Box, an associate––––––––––––––––––– professor of geology at Ohio State believes that another factor added to the early (16) (thaw), the “dark snow” problem.
According to Box, a leading Greenland expert, tundra fires in 2012 from as far away as North America produced great amounts of soot, some (17) of it–––––drifted over Greenland in giant plumes of smoke and then (18) fell–––– as particles onto the ice sheet. Scientists have long known that soot particles facilitate melting by darkening snow and ice, limiting (19) it’s–––– ability to reflect the Sun’s rays. As Box explains, “Soot is an extremely powerful light absorber. It settles over the ice and captures the Sun’s heat.” The result is a self-reinforcing cycle. As the ice melts, the land and water under the ice become exposed, and since land and water are darker than snow, the surface absorbs even more heat, which (20) is related to the rising temperatures–––––––––––––––––––––––––––––––––––––––.
[1] Box’s research is important because the fires of 2012 may not be a one-time phenomenon. [2] According to scientists, rising Arctic temperatures are making northern latitudes greener and thus more fire prone.[3] The pattern Box observed in 2012 may repeat (21) itself again––––––––––––, with harmful effects on the Arctic ecosystem. [4] Box is currently organizing an expedition to gather this crucial information. [5] The next step for Box and his team is to travel to Greenland to perform direct sampling of the ice in order to determine just how much the soot is contributing to the melting of the ice sheet. [6] Members of the public will be able to track his team’s progress—and even help fund the expedition—through a website Box has created. (22)
13. Which choice most effectively combines the two sentences at the underlined portion?Asummer, followingBsummer, and this thawing followsCsummer, and such thawing followsDsummer and this evidence followsDark Snow
Most of Greenland’s interior is covered by a thick layer of ice and compressed snow known as the Greenland Ice Sheet. The size of the ice sheet fluctuates seasonally: in summer, average daily high temperatures in Greenland can rise to slightly above 50 degrees Fahrenheit, partially melting the ice, in the winter, the sheet thickens as additional snow falls, and average daily low temperatures can drop to (12) as low as 20 degrees–––––––––––––––––––––.
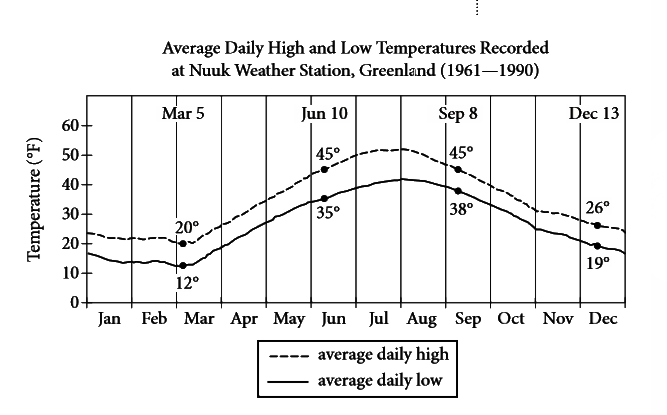
Typically, the ice sheet begins to show evidence of thawing in late (13)summer. This follows––––––––––––––––––––––– several weeks of higher temperatures. 14 For example––––––––––––––, in the summer of 2012, virtually the entire Greenland Ice Sheet underwent thawing at or near its surface by mid-July, the earliest date on record. Most scientists looking for the causes of the Great Melt of 2012 have focused exclusively on rising temperatures. The summer of 2012 was the warmest in 170 years, records show. But Jason (15) Box, an associate––––––––––––––––––– professor of geology at Ohio State believes that another factor added to the early (16) (thaw), the “dark snow” problem.
According to Box, a leading Greenland expert, tundra fires in 2012 from as far away as North America produced great amounts of soot, some (17) of it–––––drifted over Greenland in giant plumes of smoke and then (18) fell–––– as particles onto the ice sheet. Scientists have long known that soot particles facilitate melting by darkening snow and ice, limiting (19) it’s–––– ability to reflect the Sun’s rays. As Box explains, “Soot is an extremely powerful light absorber. It settles over the ice and captures the Sun’s heat.” The result is a self-reinforcing cycle. As the ice melts, the land and water under the ice become exposed, and since land and water are darker than snow, the surface absorbs even more heat, which (20) is related to the rising temperatures–––––––––––––––––––––––––––––––––––––––.
[1] Box’s research is important because the fires of 2012 may not be a one-time phenomenon. [2] According to scientists, rising Arctic temperatures are making northern latitudes greener and thus more fire prone.[3] The pattern Box observed in 2012 may repeat (21) itself again––––––––––––, with harmful effects on the Arctic ecosystem. [4] Box is currently organizing an expedition to gather this crucial information. [5] The next step for Box and his team is to travel to Greenland to perform direct sampling of the ice in order to determine just how much the soot is contributing to the melting of the ice sheet. [6] Members of the public will be able to track his team’s progress—and even help fund the expedition—through a website Box has created. (22)ANO CHANGEBHowever,CAs such,DMoreover,
Sketch shows the plot of Z vs P for 1 mol of a hypothetical gas at three distinct temperature.
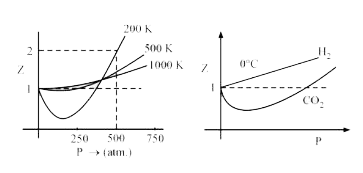
Boyle’s temperature is the temperature at which a gas shows ideal behaviour over a pressure range in the low pressure region. Boyle’s temperature (Tb)=aRb. If a plot is obtained at temperatures well below Boyle’s temperature then the curve will show negative deviation, in low pressure region and positive deviation in the high pressure region. Near critical temperature the curve is more like CO2 and the temperature well above critical temperature curve is more like H2 as shown above. At high pressure suppose all the constant temperature curve varies linearly with pressure according to the following equation: Z=1+PbRT(R=2calmol−1K−1)
For 500 K plot the value of Z changes from 2 to 2.2 if pressure is varied from 1000 atm to 1200 atm (high pressure) then the value of bRT will be :
View SolutionWhen an atom or an ion is missing from its nomal lattice site a lattice vacanecy (Schottky defect) is created. In stoichmeteric ionic crystals, a vacancy of one ion has to be accompanied by the vacancy of the oppositely charge ion in order to maintain electrical neutrality.
In a Frenkel defect an ion leaves its position in the lattice and occupies an interstitial void. This id the Frenkel defect commonly found along with the Schottky defects and interstitial. In pure alkali halides. Frenked defects are not found since the ions cannot get into the interstitial sites. Frenkel defects are found in silver halides because of the small size of the Ag+ ion. Unike Schottky defects, Frenkel defect do not change the density of the solids. in certain ionic solids (e.g., AgBr) both schottky and Frenkel defect occur.
The Defects idiscussed above do not disturb the stoichiometery of the crystalline material. there is large variety of non-stoichiometric inorganic solids which contains an excess or deficienty of one of the elements. Such solids showing deviations from the ideal stoichiometric composition from an important group of solids. For example in the vanadium oxide, VOx,x can be anywehere between 0.6 and 1.3 there are solids such as difficult to prepare in the soichiometric omposition thus, the ideal composition in compounds such as FeO is difficult to obtain (normally we get a compositiion of Fe(0.95)O but it may range from Fe0.93O to Fe0.96O). Non-stoichiometric behavious is most commonly found for transition metal compounds through is also known for some lathanoids and actinoids.
Zinc oxide loses oxygen reversible at high temperature and turns yellow in colour. the excess metal is accomodated interstitial, giving rise to electrons trapped in the neighbourhood, the enchanced electrical conductivity of the non-stoichiometric ZnO arises from these electrons.
Anion vacancies in alkali halides are produced by heating the alkali halid crystals in an atmosphere of the alkali metal vapour. when the metal atoms deposit on the surface they diffuse into the cystal and after ionisation the alkali metal ion occupies cationic vacancy whereas electron occupies anionic vacancy. Electrons trapped i anion vacancies are referred to as F-centers (From Farbe the German word for colouf) that gives rise to interesting colour in alkali halides. Thus, the excess of potassium i KCl makes the crystal appear violet and the excess of lithium in LiCl makes it pink.
Which of the following is most appropritate crystal to show Frenkel defect ?
View SolutionIdeal gas equation is represented as PV=nRT. Gases present in universe were fond ideal in the Boyle's temperature range only and deviated more from ideal gas behavior at high pressure and low temperature.
The deviation are explained in term of compressibility factor z. For ideal behavior Z=PVnRT=1. the main cause to show deviavtion were due to wrong assumptions made about forces oif attractions (which becomes significant at high pressure ) and volume V occupied by molecules in PV=nRT is supposed to be volume of gas or the volume of container in which gas is placed by assuming that gaseous molecules do not have appreciable volume. Actually volume of the gas is that volume in which each molecule of gas can move freely. If volume occupied by gaseous molecule is not negligible, then the term V would be replaced by the ideal volume which by available for free motion of each molecule of gas in 1 mole gas.
Vactual= volume of container -volume occupied by molecules
=v−b
Where b represent the excluded volume occupied by molecules present in one mole of gas.
Similarly for n mole gas
Vactual=v−nb
The ratio of coefficient of thermal expansion α=(∂V∂T)PV and the isothermal compressibility
β=−(∂V(∂P)T) for an ideal gas is:
View SolutionIdeal gas equation is represented as PV=nRT. Gases present in universe were fond ideal in the Boyle's temperature range only and deviated more from ideal gas behavior at high pressure and low temperature.
The deviation are explained in term of compressibility factor z. For ideal behavior Z=PVnRT=1. the main cause to show deviavtion were due to wrong assumptions made about forces oif attractions (which becomes significant at high pressure ) and volume V occupied by molecules in PV=nRT is supposed to be volume of gas or the volume of container in which gas is placed by assuming that gaseous molecules do not have appreciable volume. Actually volume of the gas is that volume in which each molecule of gas can move freely. If volume occupied by gaseous molecule is not negligible, then the term V would be replaced by the ideal volume which by available for free motion of each molecule of gas in 1 mole gas.
Vactual= volume of container -volume occupied by molecules
=v−b
Where b represent the excluded volume occupied by molecules present in one mole of gas.
Similarly for n mole gas
Vactual=v−nb
As the pressure approaching zero i.e. at very low pressure. The curves plotted between compressibility factor Z and P for n mole of gases have the following characteristics.
(I) The intercept on y-axis leads to a value of unity
(II) The intercept on y axis leads to a value of 'n'
(III) The curves posses same slope for different gases at same temperature
(IV) The curves posses different slopes for different gases at same temperature.
(V) The curves posses same slope for a gas at different temperature
View SolutionDark Snow
Most of Greenland’s interior is covered by a thick layer of ice and compressed snow known as the Greenland Ice Sheet. The size of the ice sheet fluctuates seasonally: in summer, average daily high temperatures in Greenland can rise to slightly above 50 degrees Fahrenheit, partially melting the ice, in the winter, the sheet thickens as additional snow falls, and average daily low temperatures can drop to (12) as low as 20 degrees–––––––––––––––––––––.
Typically, the ice sheet begins to show evidence of thawing in late (13)summer. This follows––––––––––––––––––––––– several weeks of higher temperatures. 14 For example––––––––––––––, in the summer of 2012, virtually the entire Greenland Ice Sheet underwent thawing at or near its surface by mid-July, the earliest date on record. Most scientists looking for the causes of the Great Melt of 2012 have focused exclusively on rising temperatures. The summer of 2012 was the warmest in 170 years, records show. But Jason (15) Box, an associate––––––––––––––––––– professor of geology at Ohio State believes that another factor added to the early (16) (thaw), the “dark snow” problem.
According to Box, a leading Greenland expert, tundra fires in 2012 from as far away as North America produced great amounts of soot, some (17) of it–––––drifted over Greenland in giant plumes of smoke and then (18) fell–––– as particles onto the ice sheet. Scientists have long known that soot particles facilitate melting by darkening snow and ice, limiting (19) it’s–––– ability to reflect the Sun’s rays. As Box explains, “Soot is an extremely powerful light absorber. It settles over the ice and captures the Sun’s heat.” The result is a self-reinforcing cycle. As the ice melts, the land and water under the ice become exposed, and since land and water are darker than snow, the surface absorbs even more heat, which (20) is related to the rising temperatures–––––––––––––––––––––––––––––––––––––––.
[1] Box’s research is important because the fires of 2012 may not be a one-time phenomenon. [2] According to scientists, rising Arctic temperatures are making northern latitudes greener and thus more fire prone.[3] The pattern Box observed in 2012 may repeat (21) itself again––––––––––––, with harmful effects on the Arctic ecosystem. [4] Box is currently organizing an expedition to gather this crucial information. [5] The next step for Box and his team is to travel to Greenland to perform direct sampling of the ice in order to determine just how much the soot is contributing to the melting of the ice sheet. [6] Members of the public will be able to track his team’s progress—and even help fund the expedition—through a website Box has created. (22)
View Solution
