The speed-time graph of an object moving in a fixed direction is shown in Figure 2.E4.
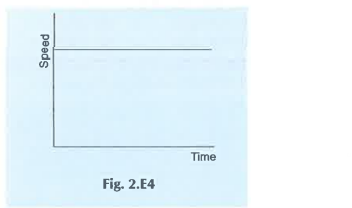
The object
is at rest
movies with fluctuating speed
moves with a constant speed
moves with a nonzero acceleration
The correct Answer is:C
Topper's Solved these Questions
Similar Questions
The speed-time graph of a particle moving along a fixed direction is shown in Fig. Then which of the following is wrong?

View SolutionThe velocity (u)-time (t) graph of an object moving along a straight line is as shown is Fig. 2 (b) . 30. Calculate the distance covered by object between (i)t=0→t=5s (ii) t=0→t=10s.
 .
.
View Solution
Knowledge Check
The speed-time graph of an object moving in a fixed direction is shown in figure 2.E3.
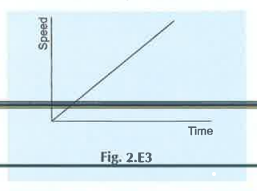
The objectAis at restBmoves with a constant speedCmoves with a constant velocityDmoves with a constant accelerationThe distance-time graph of an object moving in a fixed direction is shown in figure 2.E1.
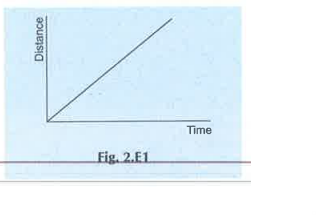
The objectAis at restBmoves with a constant velocityCmoves with a variable velocityDmoves with a constant accelerationThe speed-time graph of a particle moving along a fixed direction as shown in the figure. The distance traversed by the particle between t = 0 s to t = 10 s is
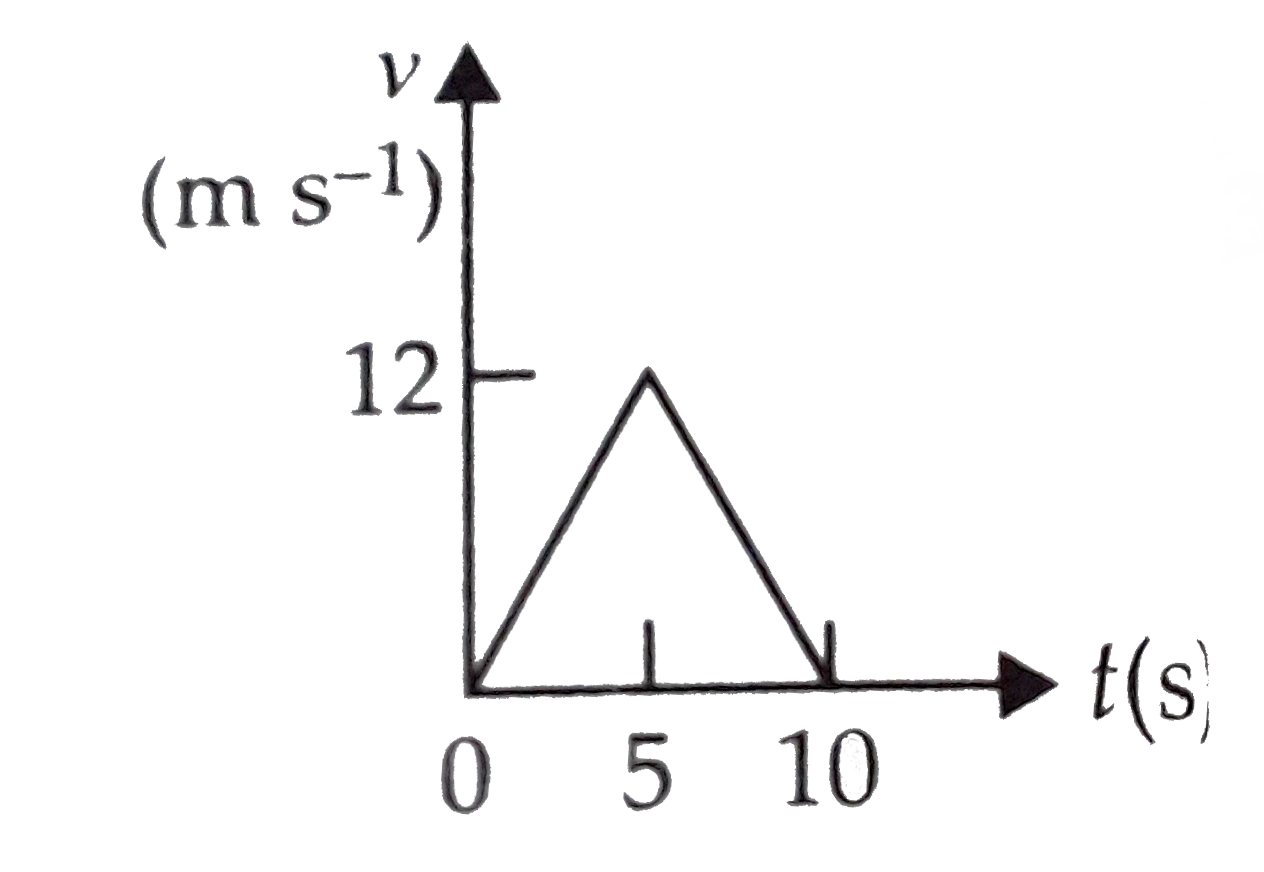 A20 mB40 mC60 mD80 m
The velocity (u)-time (t) graph of an object moving along a straight line is as shown is Fig. 2 (b) . 30. Calculate the distance covered by object between (i)t=0→t=5s (ii) t=0→t=10s.
 .
.
View SolutionThe displacement-time graph of a moving object is shown in figure. Which of the velocity-time graphs shown in figure could represent the motion of the same body ?
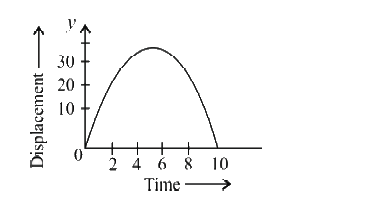
View SolutionThe speed-time graph of a particle moving along a fixed direction as shown in the figure. The distance travelled by the particle between t = 0 s to t = 10 s is

View SolutionThe position-time graph of an object moving in a straight line is shown below. The object has zero velocity at
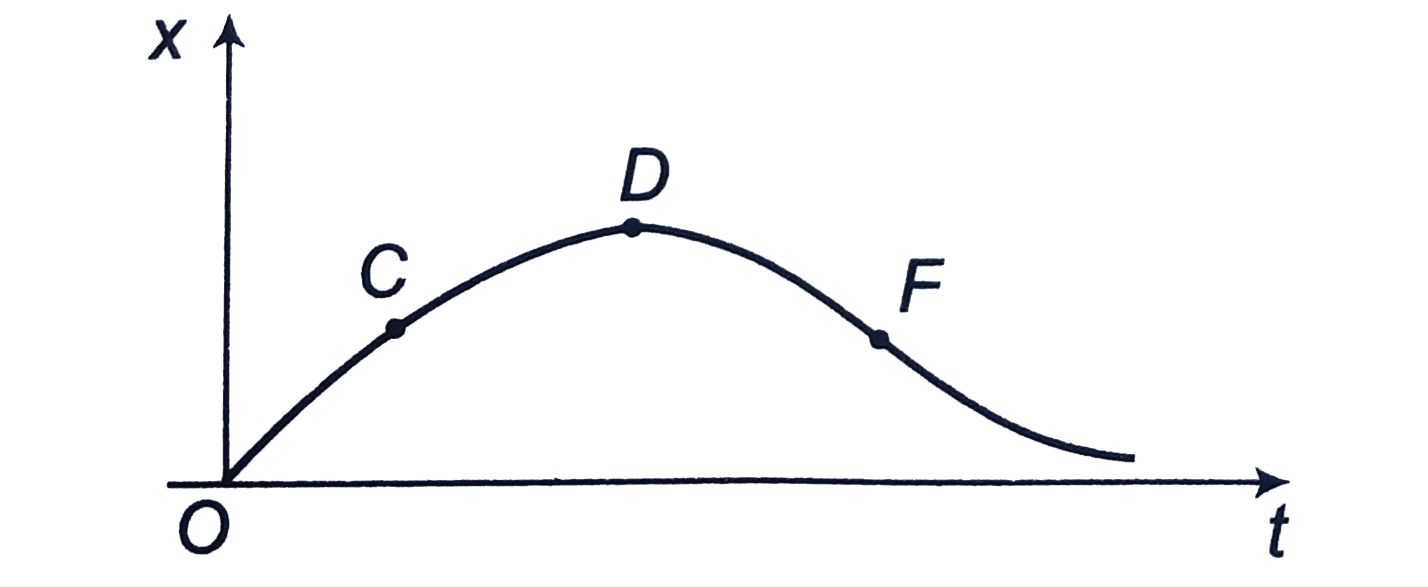
View SolutionThe distance-time graph of an object shown in figure 2.E2.
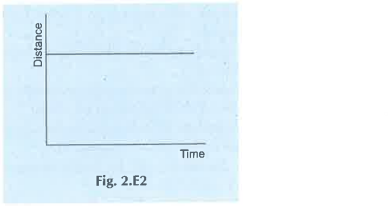
The object
View Solution
