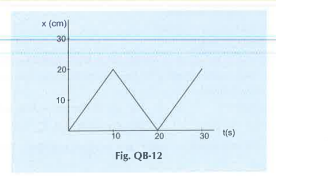
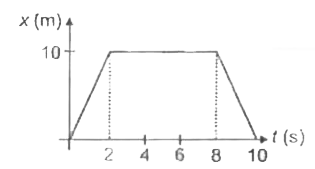
Mark the statement True (T) or False (F): The position -time graph of a particle moving along a straight line in as shown in the figure. Its speed in constant.
Text Solution
The correct Answer is:T
|
Topper's Solved these Questions
Similar Questions
Knowledge Check
Displacement time graph of a particle moving in a straight line is a shown in figure.
 Ain region A acceleration is positiveBin region B acceleration is negativeCin region C acceleration is positiveDin region D acceleration is negative
The velocity - time graph of a particle moving along a straight line is shown in the figure given below
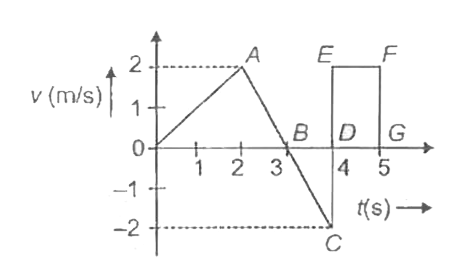
The displacement of the particle in 5 second isA0.5 mB1 mC2 mD4 mDisplacment-time graph of a particle moving in a straight line is as shown in figure. Choose the INCORRECT statement(s)
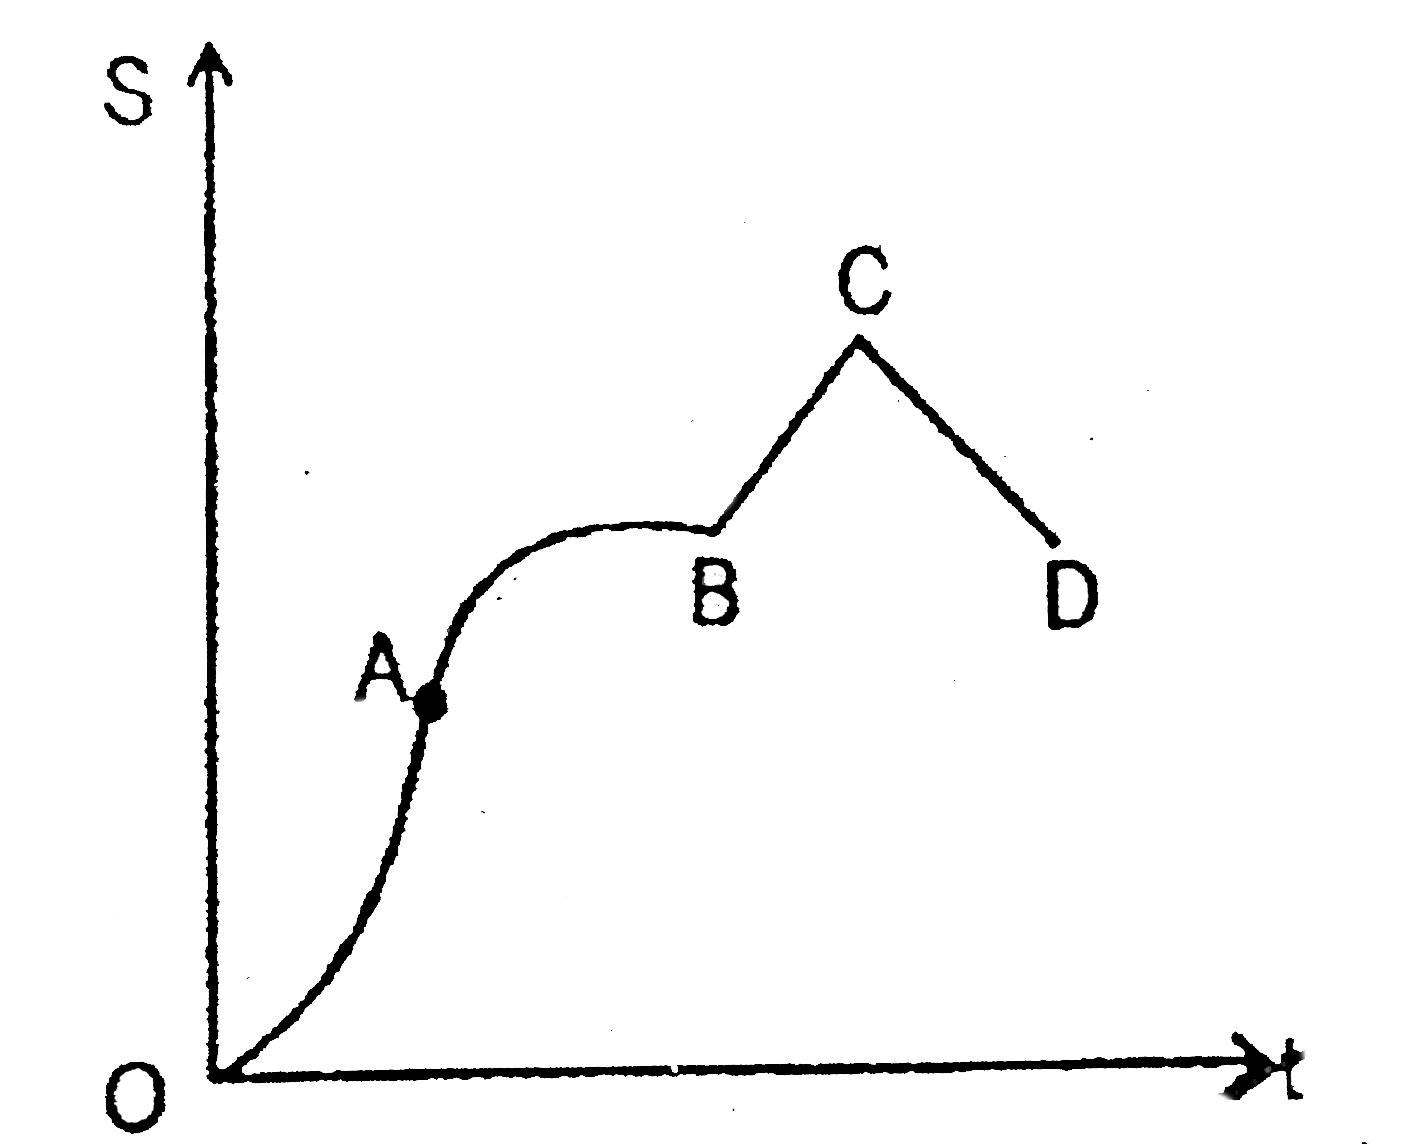 AIn region OA acceleration is positive.BIn region AB acceleration is nagetive.CIn region BC acceleration is nagetive.DIn region CD acceleration is nagetive.
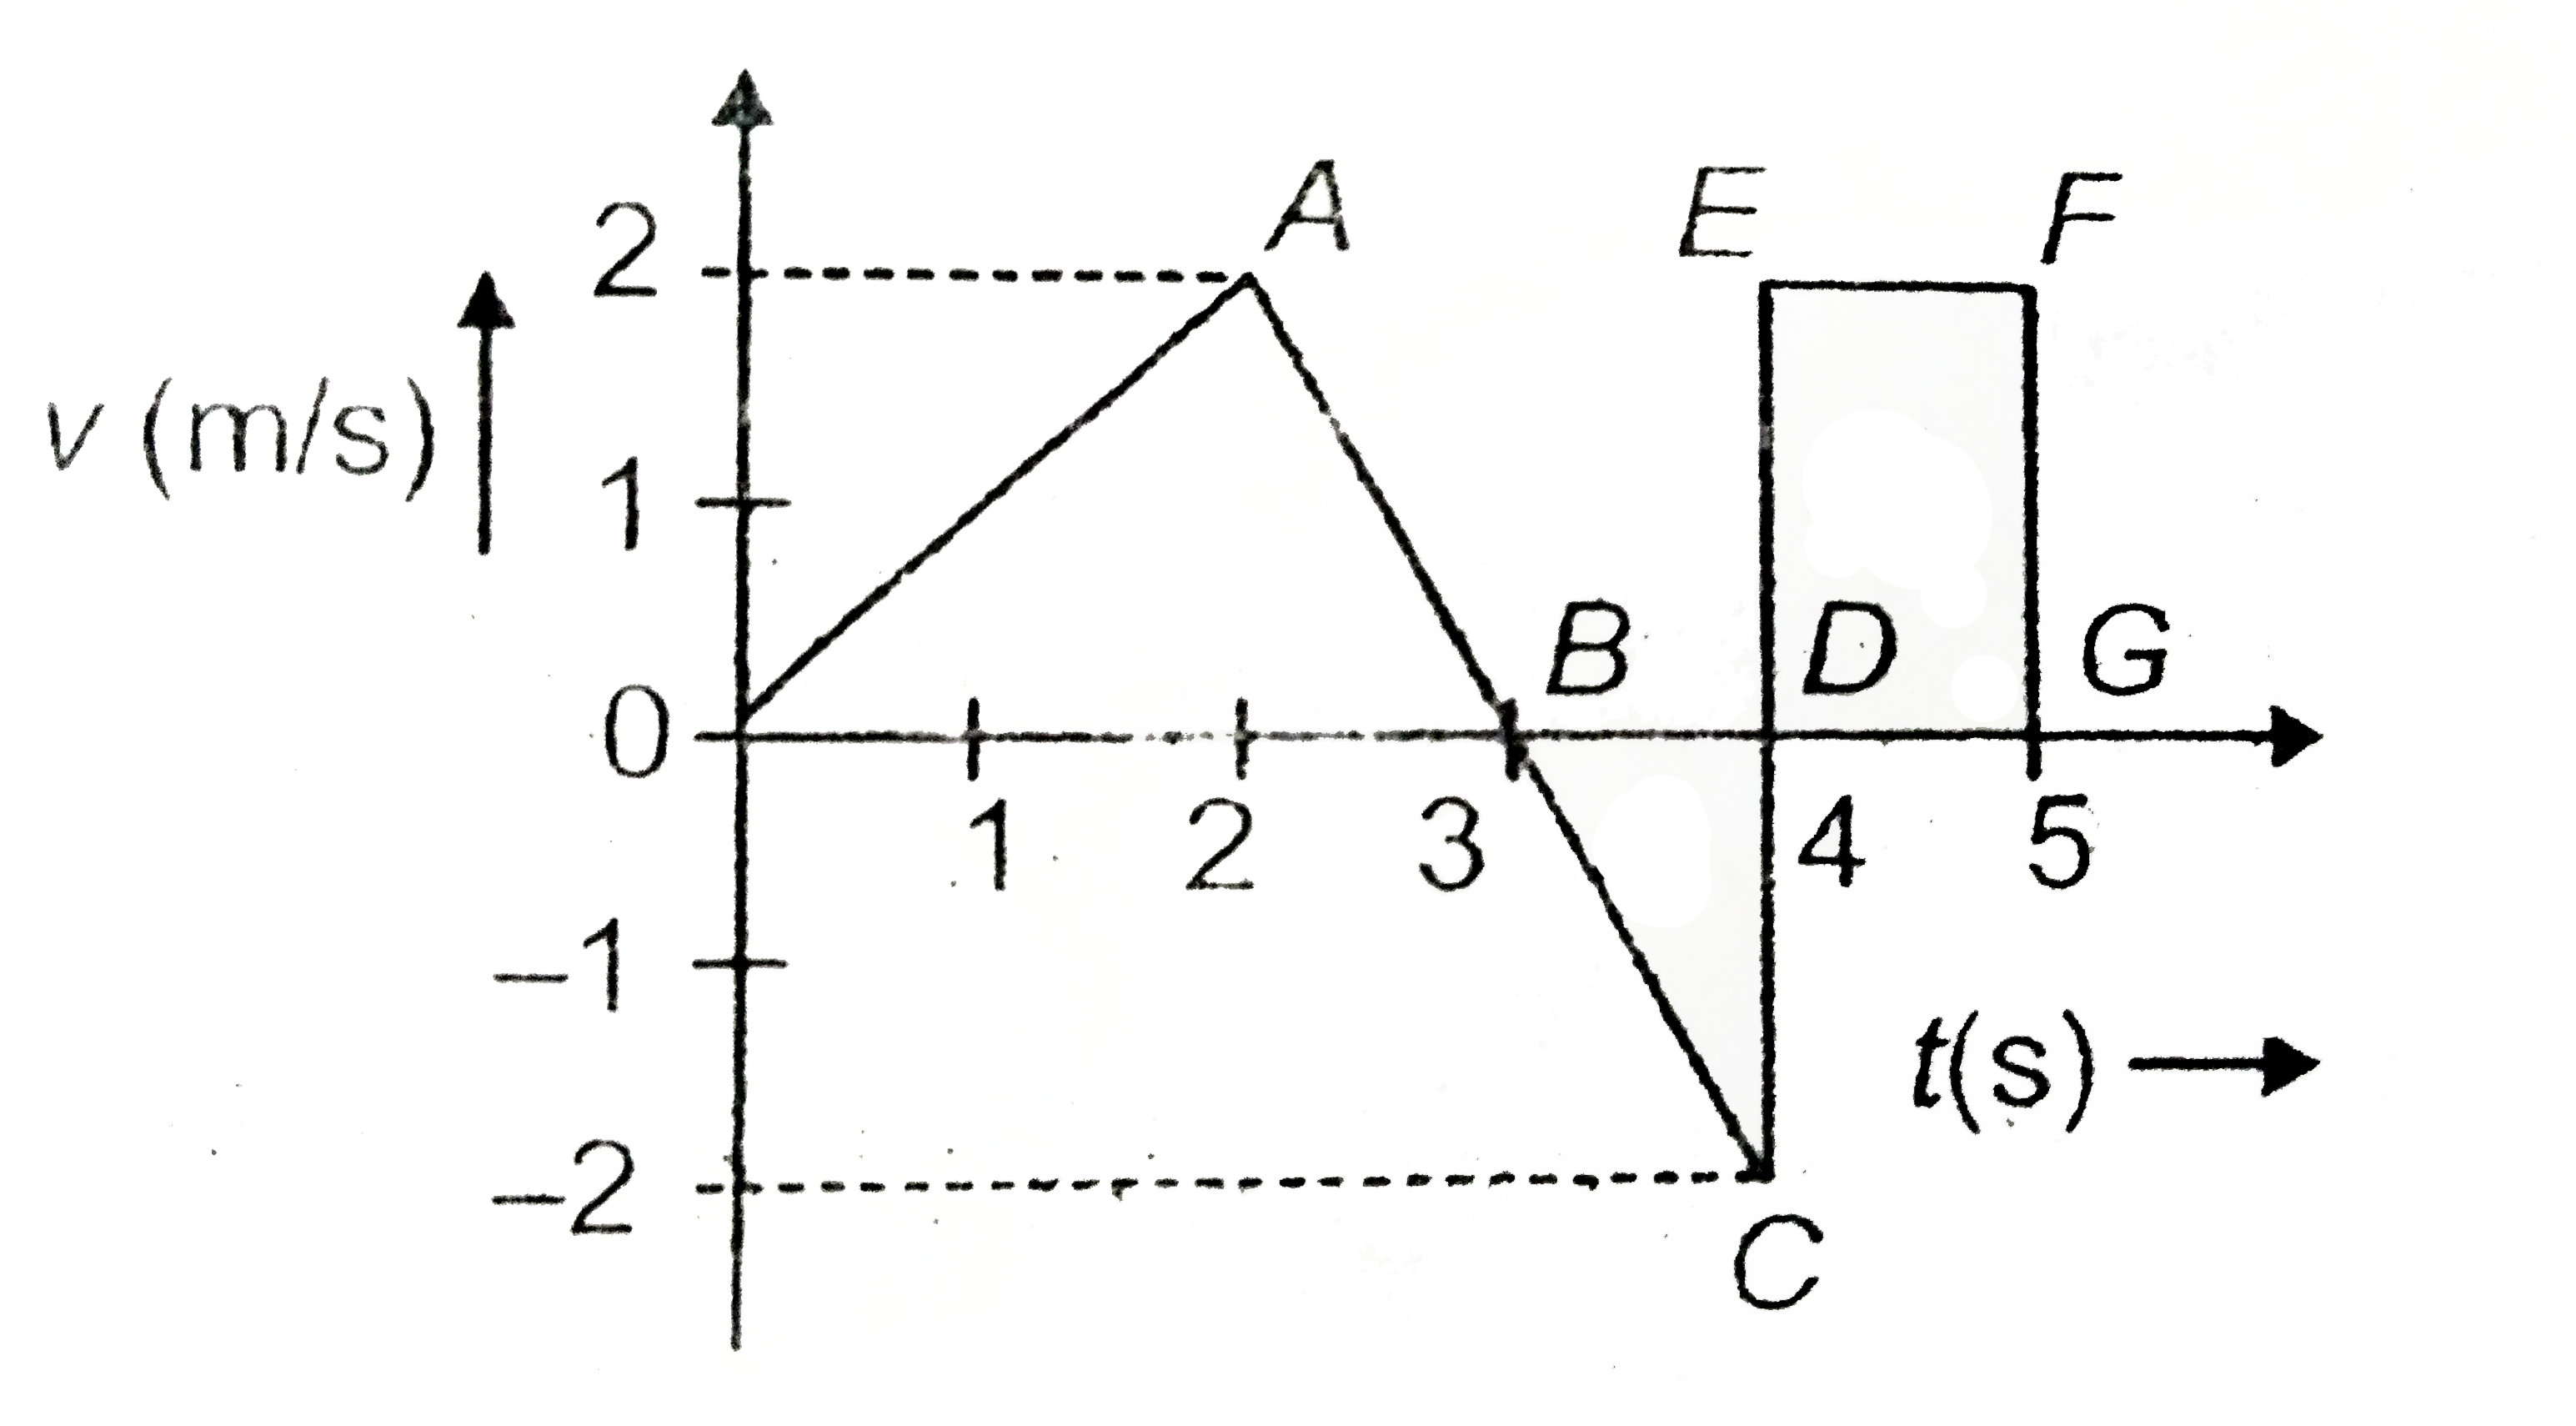
The velocity - time graph of a particle moving along a straight line is shown in the figure given below
The displacement of the particle in 5 second is

View SolutionDisplacment-time graph of a particle moving in a straight line is as shown in figure. Choose the INCORRECT statement(s)

View SolutionThe position - time graph for a particle moving along a straight line is shown in figure. The total distance travelled by it in time t = 0 to t = 10 s is
View SolutionThe velocity-time graph of a particle moving along a straight line is shown in the figure-given below
The displacement of the particle in 5 second is
View SolutionThe position - time graph for a particle moving along a straight line is shown in figure. The total distance travelled by it in time t = 0 to t = 10 s is

View Solution

