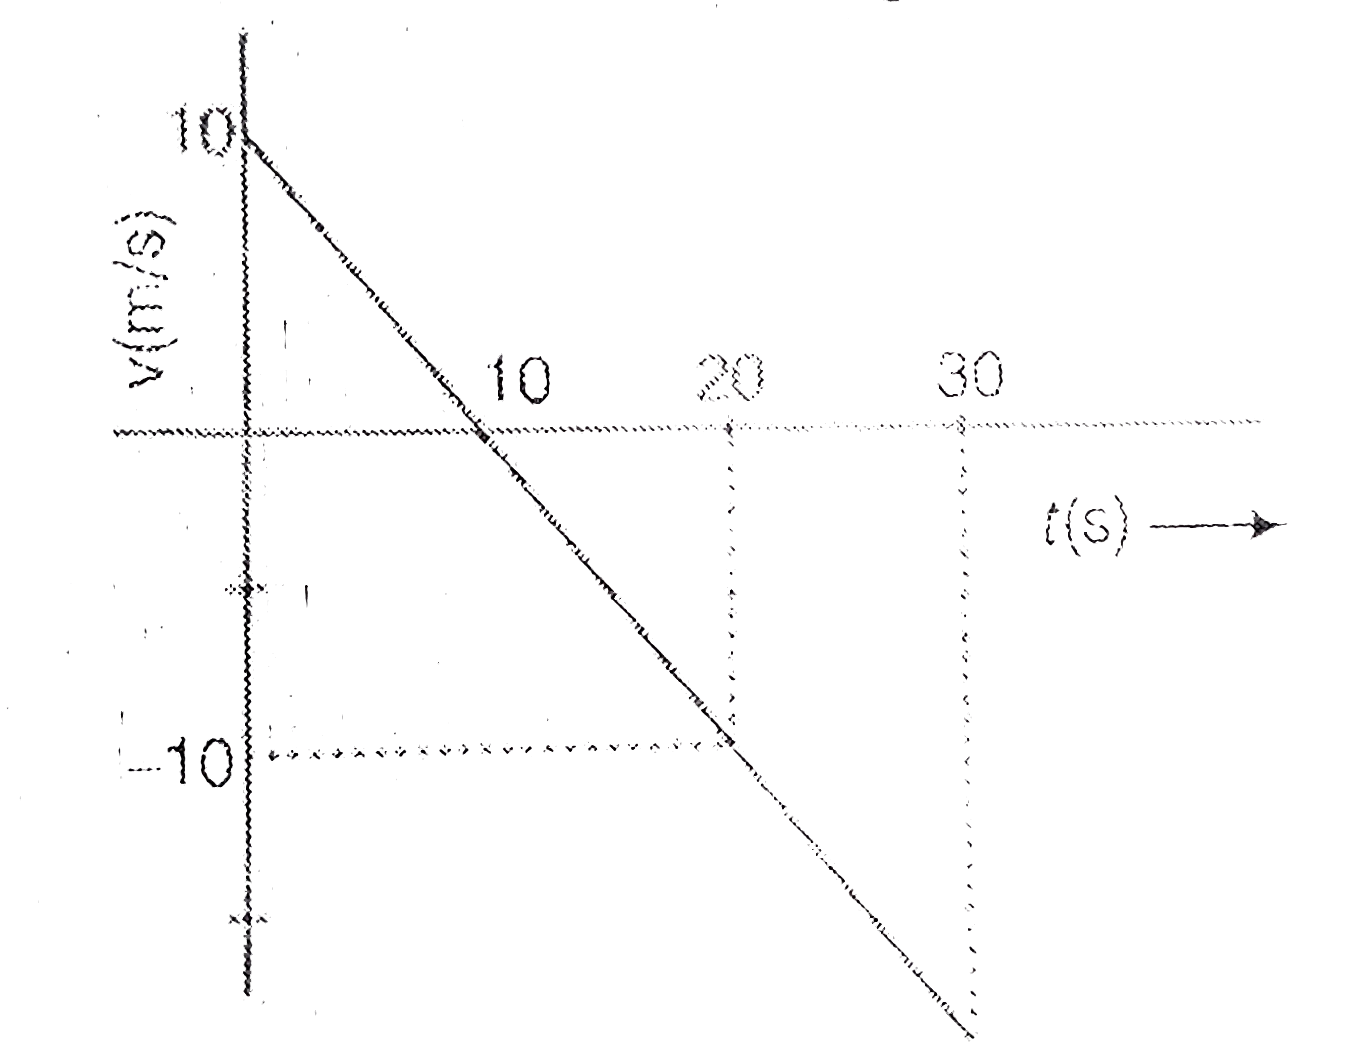
The velocity of a particle moving along a straight line varies with time as shown in the Figure. Find the total distance covered and the total displacement between 0 and 20 seconds.
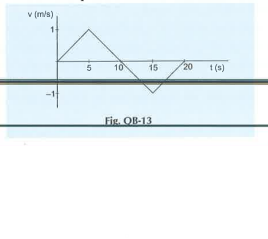
Text Solution
5m, zero
|
Topper's Solved these Questions
Similar Questions
Knowledge Check
The velocity- time plot for a particle moving on a straight line is shown in the figure
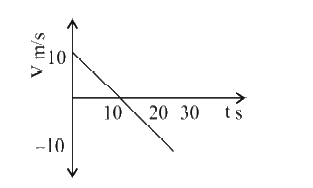 Athe particle has a non uniform accelerationBthe particle has never turned aroundCthe particle has zero displacementDthe average speed in the interval 0 to 10 s is the same as the average speed in the interval 10 s to 20 s
The velocity-time plot for a particle moving on a straight line is shown in figure.
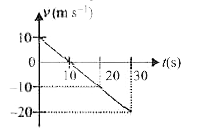 AThe particle has a constant acceleration.BThe particle has never tumed around.CThe particle has zero displacement.DThe average speed in the interval 0 to 10 s is the same as the average speed in the interval 10s to 20 s.
Velocity displacement graph of a particle moving in a straight line is as shown in figure.
 Amagnitude of acceleration of particle is decreasingBmagnitude of acceleration of particlre is increasingCacceleration versus displacement graph straight lineDacceleration versus displacement graph is parabola
The velocity time plot for a particle moving on straight line is shown in the figure.

View SolutionThe velocity time plot for a particle moving on straight line is shown in the figure.

View SolutionThe variation of velocity of a particle moving along a straight line is shown in the figure. The distance travelled by the particle in 4s is

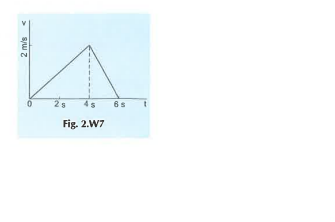
View SolutionThe velocity-time graph of a particle moving along a straight line is shown in Figure 2.W7.Is the motion uniform?
View SolutionThe velocity time plot for a particle moving on straight line is shown in the figure.

View Solution

