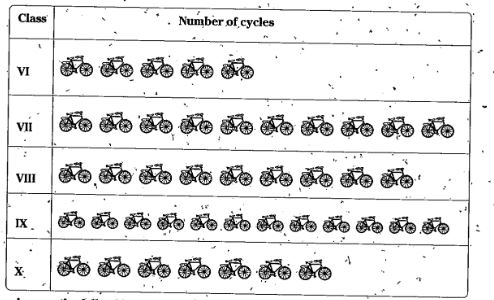
The following pictograph shows the number of students’ cycles, in five classes of a school. Which class students have 9 cycles? Solution in Telugu
Step by step video & image solution for The following pictograph shows the number of students’ cycles, in five classes of a school. Which class students have 9 cycles? by Maths experts to help you in doubts & scoring excellent marks in Class 6 exams.
Updated on:21/07/2023Topper's Solved these Questions
- DATA HANDLINGBOOK - NCERT TELUGUCHAPTER - DATA HANDLINGEXERCISE - EXERCISE - 8.3
8 Videos
- DATA HANDLINGBOOK - NCERT TELUGUCHAPTER - DATA HANDLINGEXERCISE - EXERCISE - 8.1
8 Videos
- BASIC GEOMETRICAL IDEASBOOK - NCERT TELUGUCHAPTER - BASIC GEOMETRICAL IDEASEXERCISE - THINK AND DISCUSS
1 Videos
- FRACTION AND DECIMALSBOOK - NCERT TELUGUCHAPTER - FRACTION AND DECIMALSEXERCISE - EXERCISE
203 Videos
Similar Questions
The life span of animals is given as follows: bear-40 years, Bull-28 years, camel-50 years ,dog-22 years, donkey- 45 years, goat- 15 years, horse-10 years, cow-22 years, elephant-70 years. Draw a horizontal bar graph to represent the data.
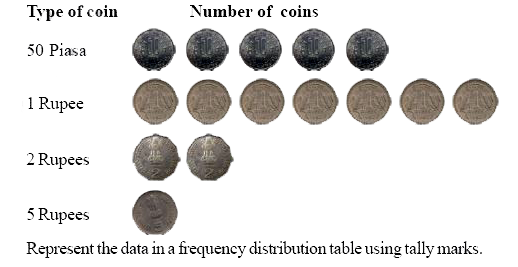
View SolutionA child's Kiddy bank is opened and the coins collected are in the following denomination.

View SolutionIs it possible to draw more than one diameter in a circle? Are all the diameters equal in length ?
View SolutionHow will you represent the following pictorially : - 34
View SolutionHow many lines of symmetry does the above figure have ?
View SolutionWhich of the following are correct chain isomers of butane ? (i)
View SolutionDetermine the point of symmetry of a regular hexagon.
View SolutionDtermine the images of the following figure about the given line :
View SolutionMatch the following Column A to Column B

View SolutionMatch the following Column A to Column B

View SolutionMatch the following Column A to Column B

View SolutionThe inequation represented by the graph given below is :
View SolutionThe inequation that best describes the graph given below is _________
View SolutionThe inequation that best describes the following graph is _________
View SolutionWhich inequations represent the shaded region in the given figure
View SolutionFrom the following figure, the correct observation is :- ltimg src="https://d10lpgp6xz60nq.cloudfront.net/physics_images/ALN_PHY_R03_E08_015_Q01.png" width="80%"gt
View Solution
