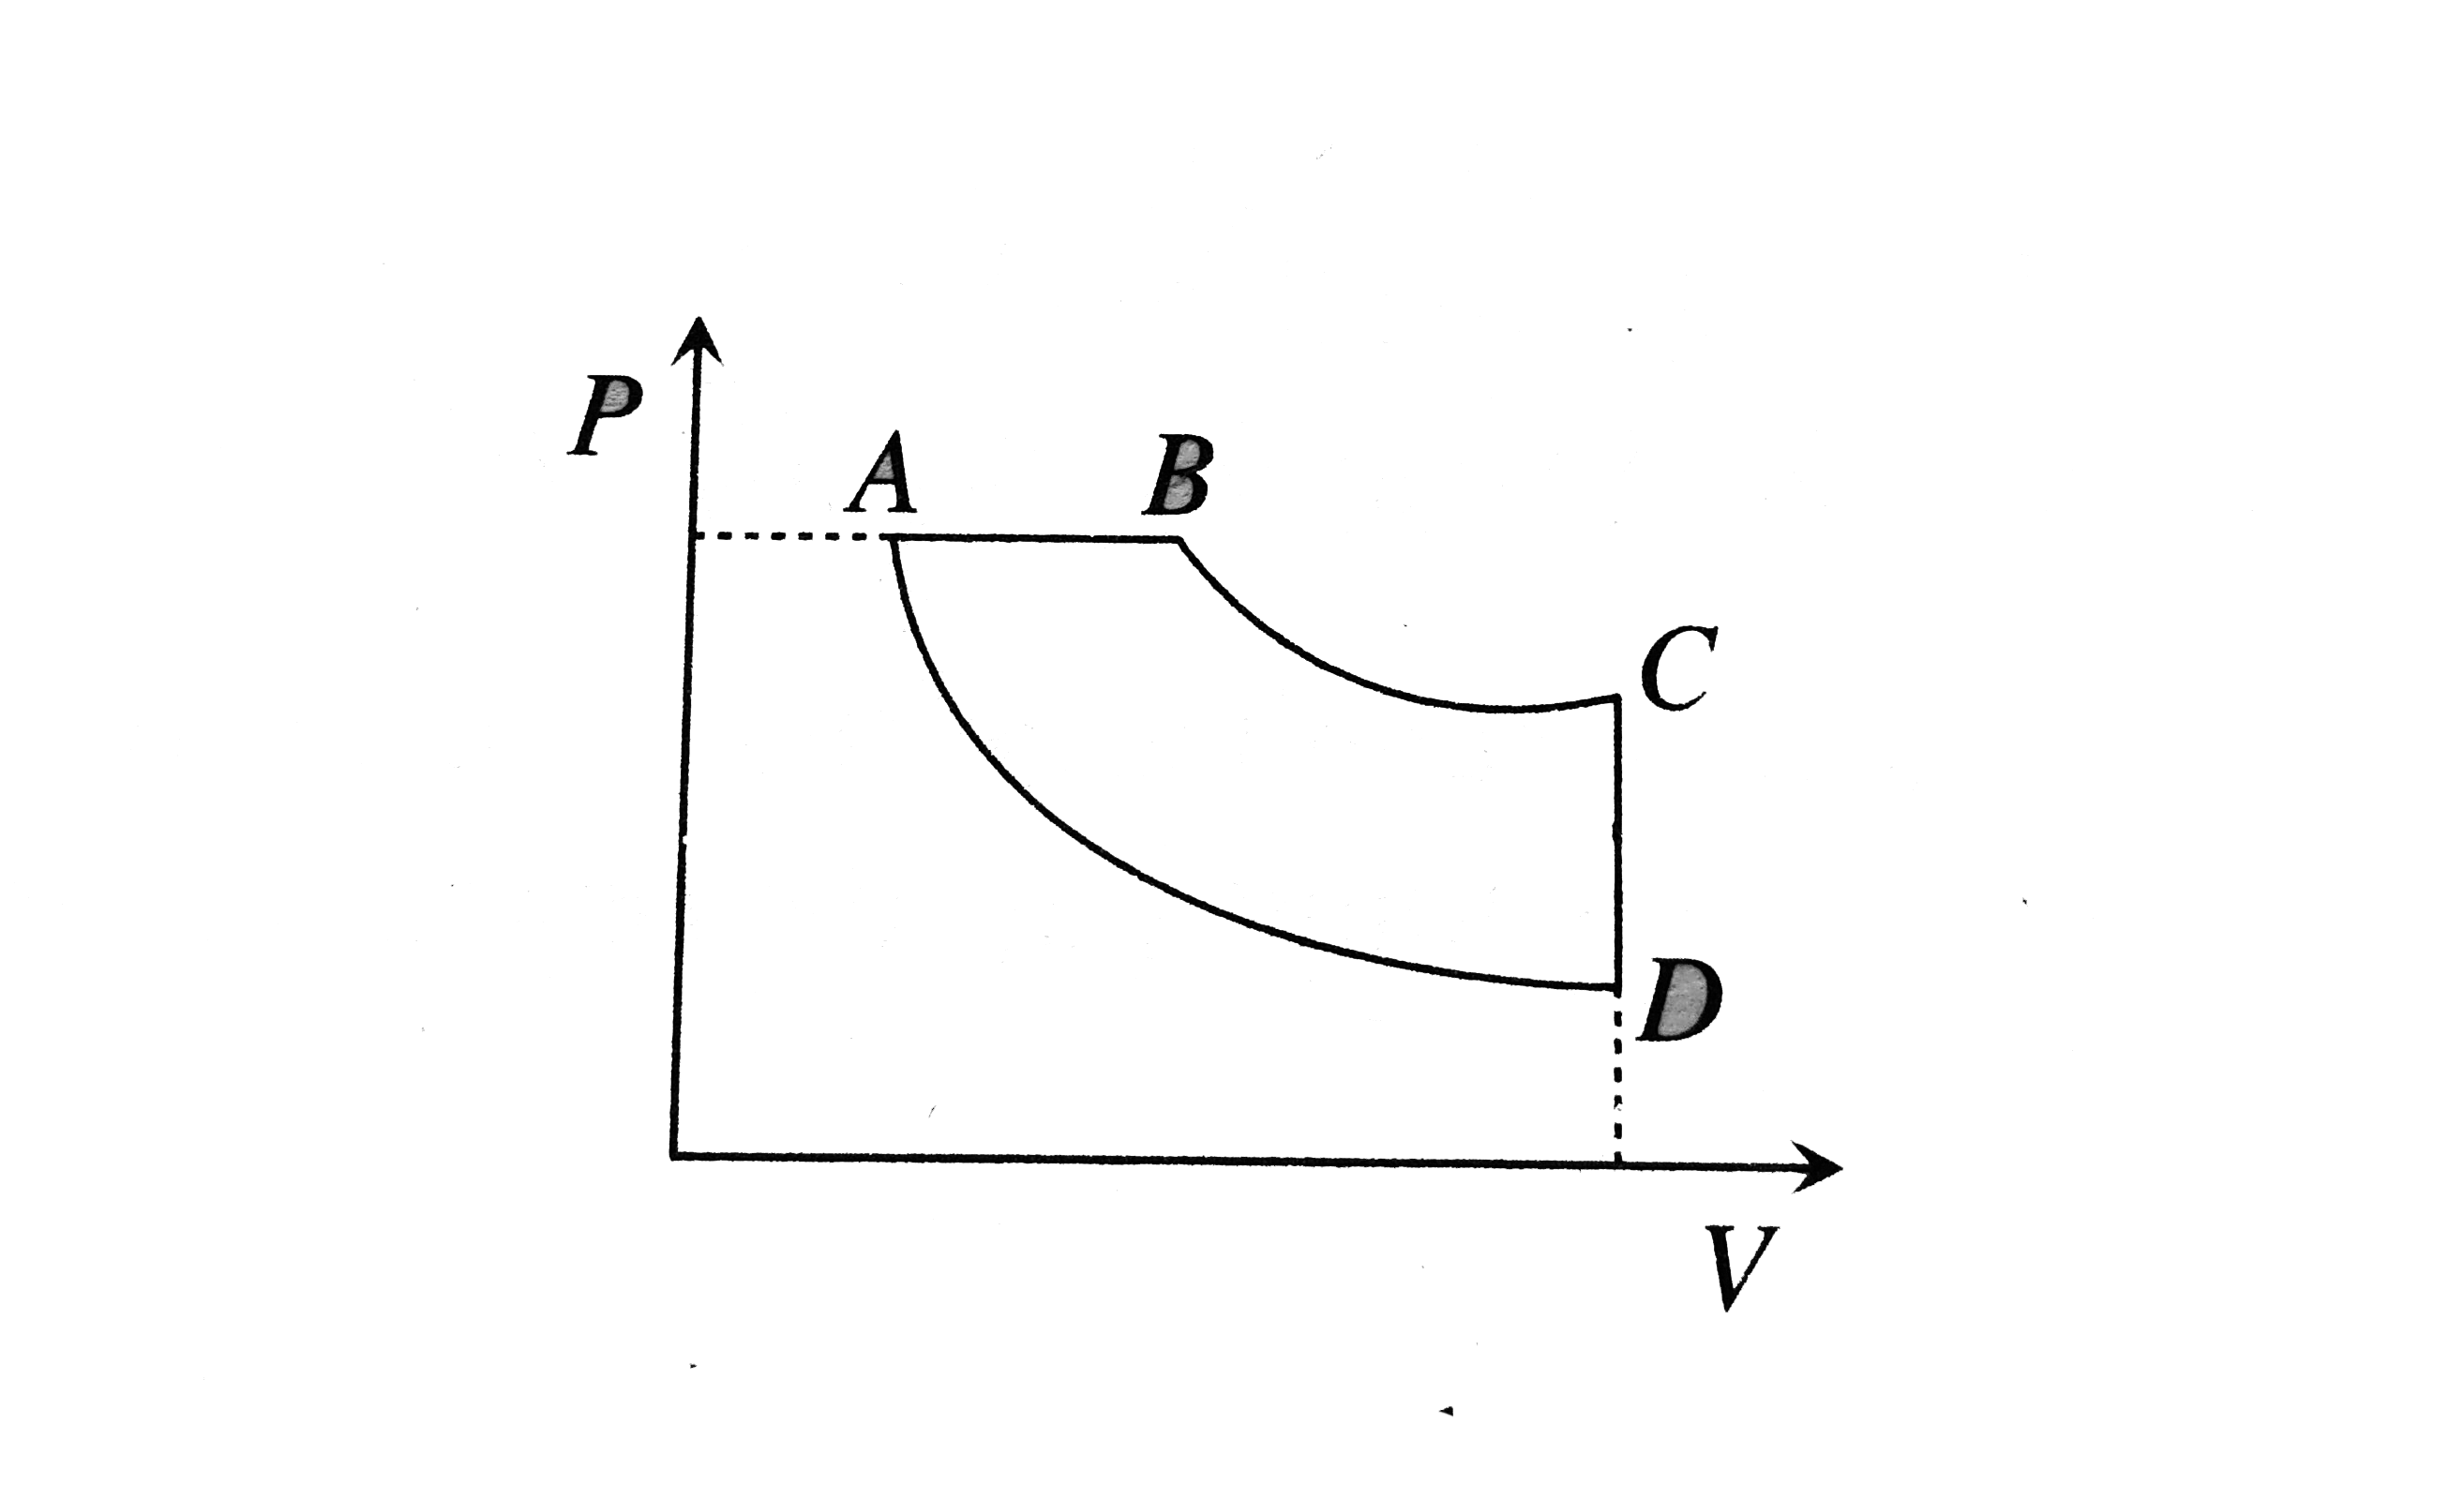
Consider the following cyclic process consist of isotherm, isochoric and isobar which is given in the figure.
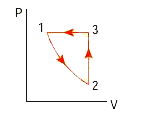
Draw the same cyclic process qualitatively in the V-T diagram where T is taken along x direction and V is taken along y-direction. Analyze the nature of heat exchange in each process.
Text Solution
The correct Answer is:T=36.9∘C
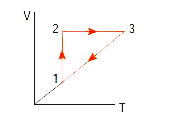
Process 1 to 2 = increase in volume. So heat must be added. Process 2 to 3 = Volume remains constant. Increase in temperature. The given heat is used to increase the internal energy. Process 3 to 1 : Pressure remains constant. Volume and Temperature are reduced. Heat flows out of the system. It is an isobaric compression where the work is done on the system.
|
Topper's Solved these Questions
- HEAT AND THERMODYNAMICSBOOK - NCERT TAMILCHAPTER - HEAT AND THERMODYNAMICSEXERCISE - EVALUATION (MULTIPLE CHOICE QUESTIONS)
15 Videos
- GRAVITATIONBOOK - NCERT TAMILCHAPTER - GRAVITATIONEXERCISE - ADDITIONAL EXERCISES
4 Videos
- KINEMATICSBOOK - NCERT TAMILCHAPTER - KINEMATICSEXERCISE - EXERCISE (IV. Exercises )
20 Videos
Similar Questions
Knowledge Check
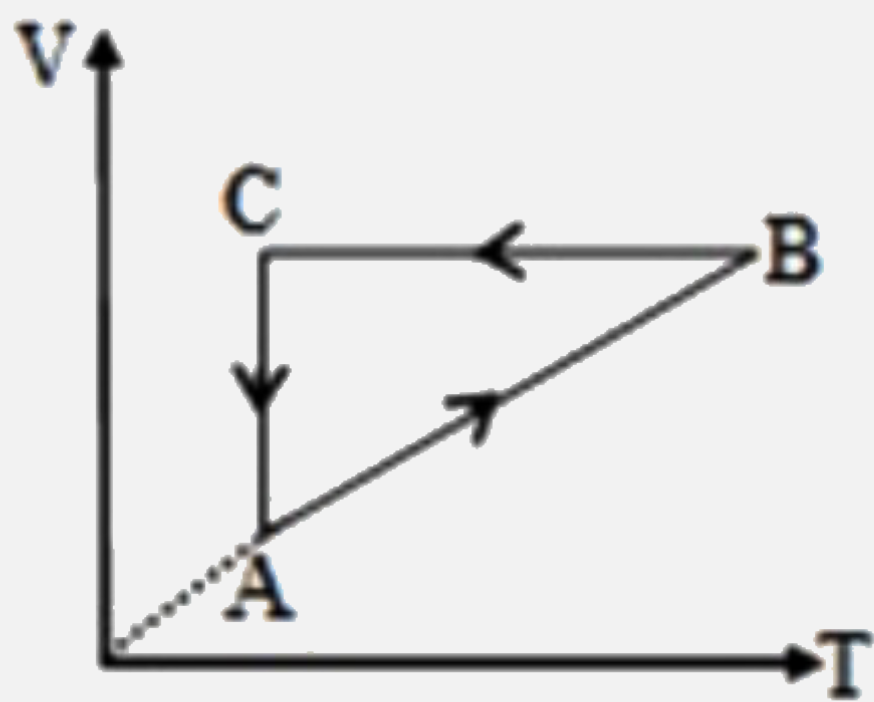
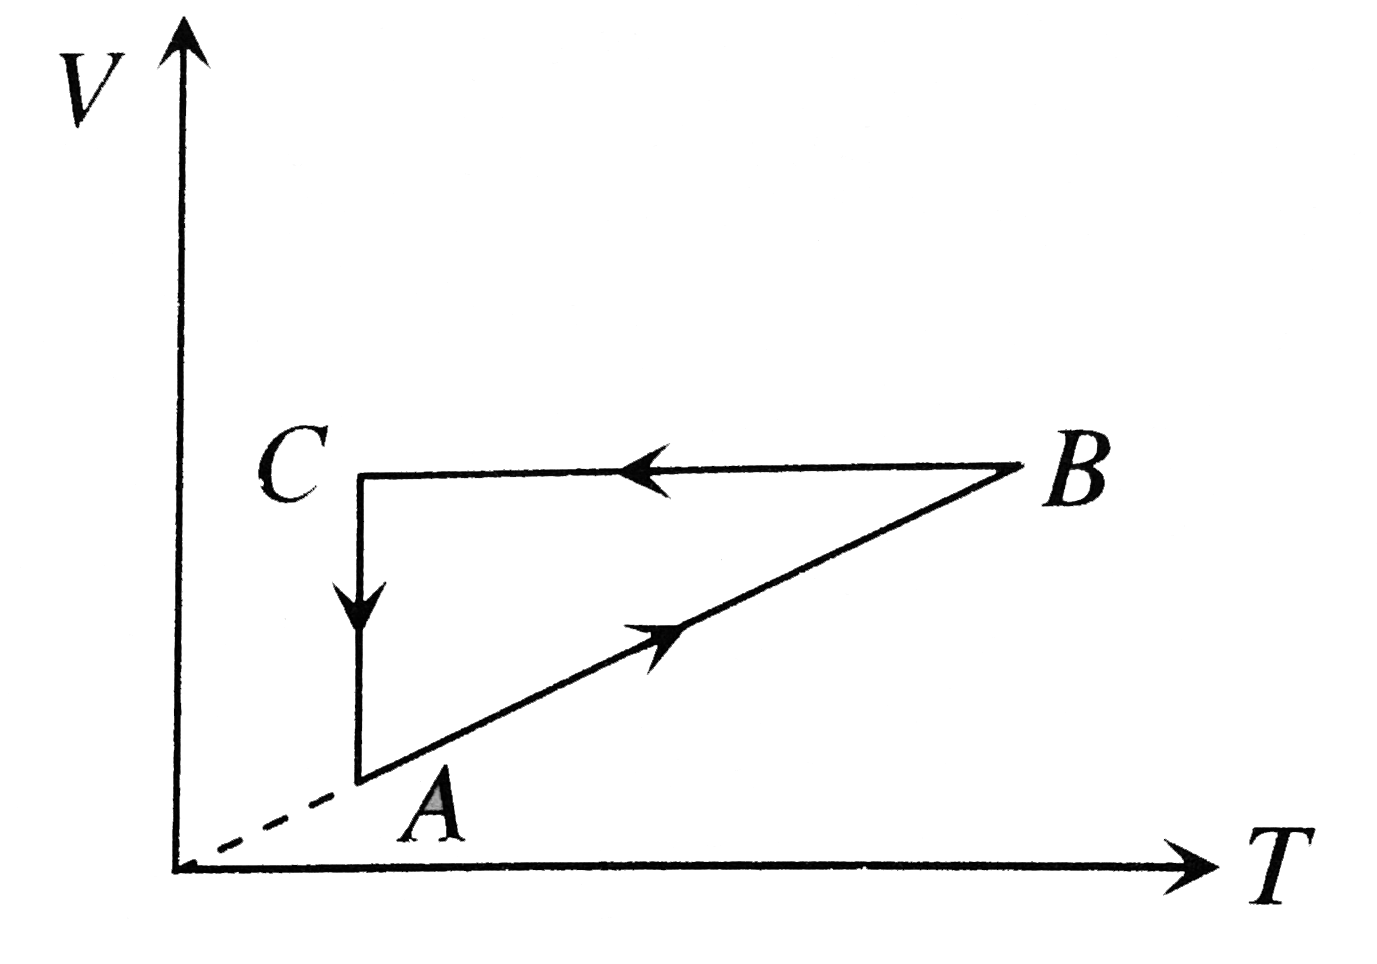
A cyclic process ABCA is shown in the V−T diagram process on the P−V
 A
A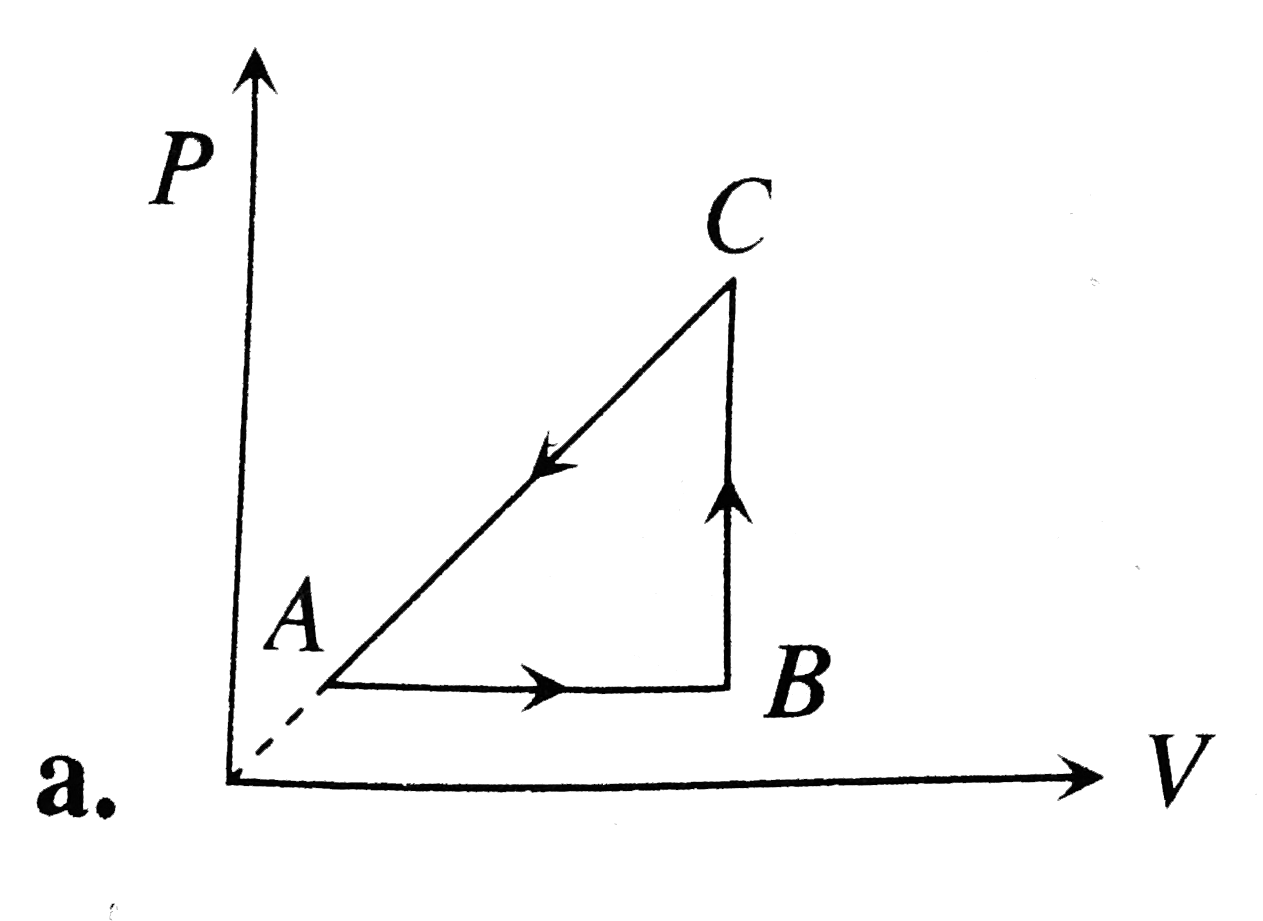 B
B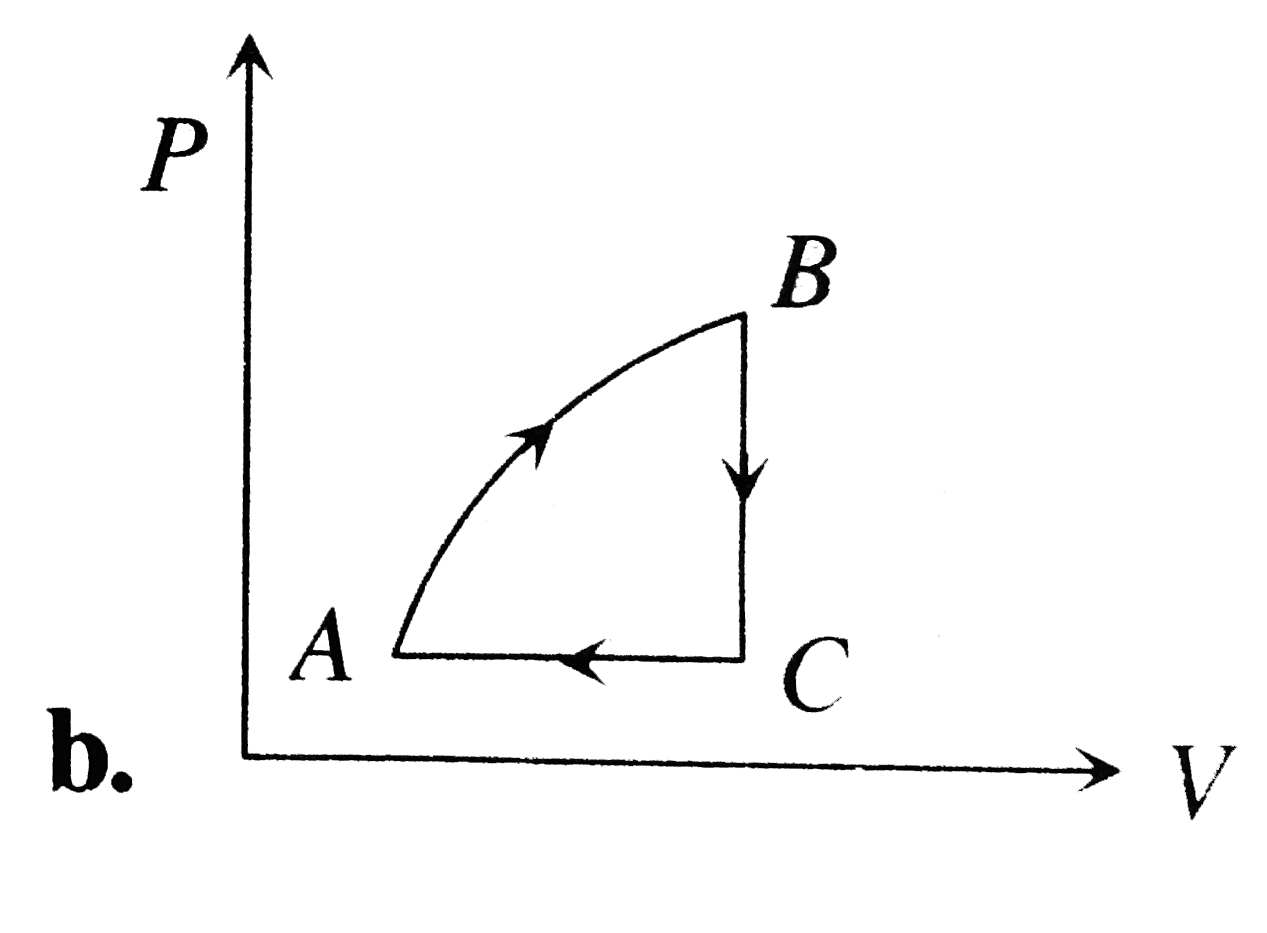 C
C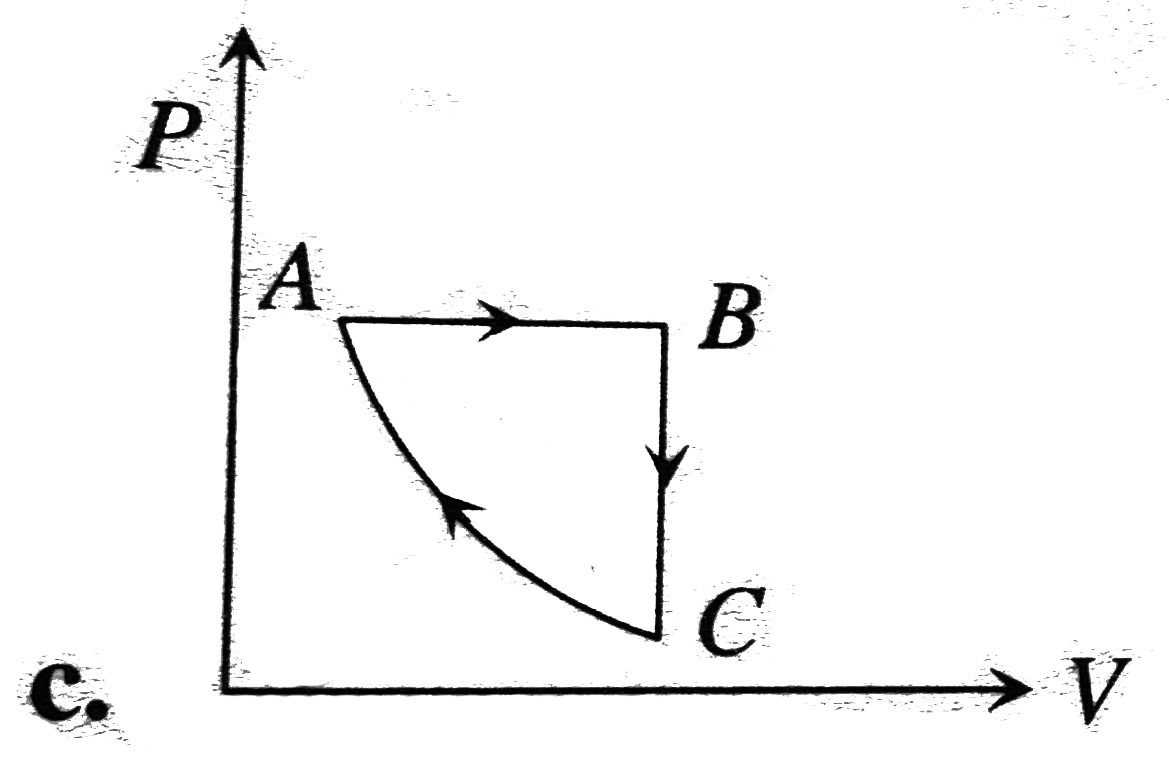 D
D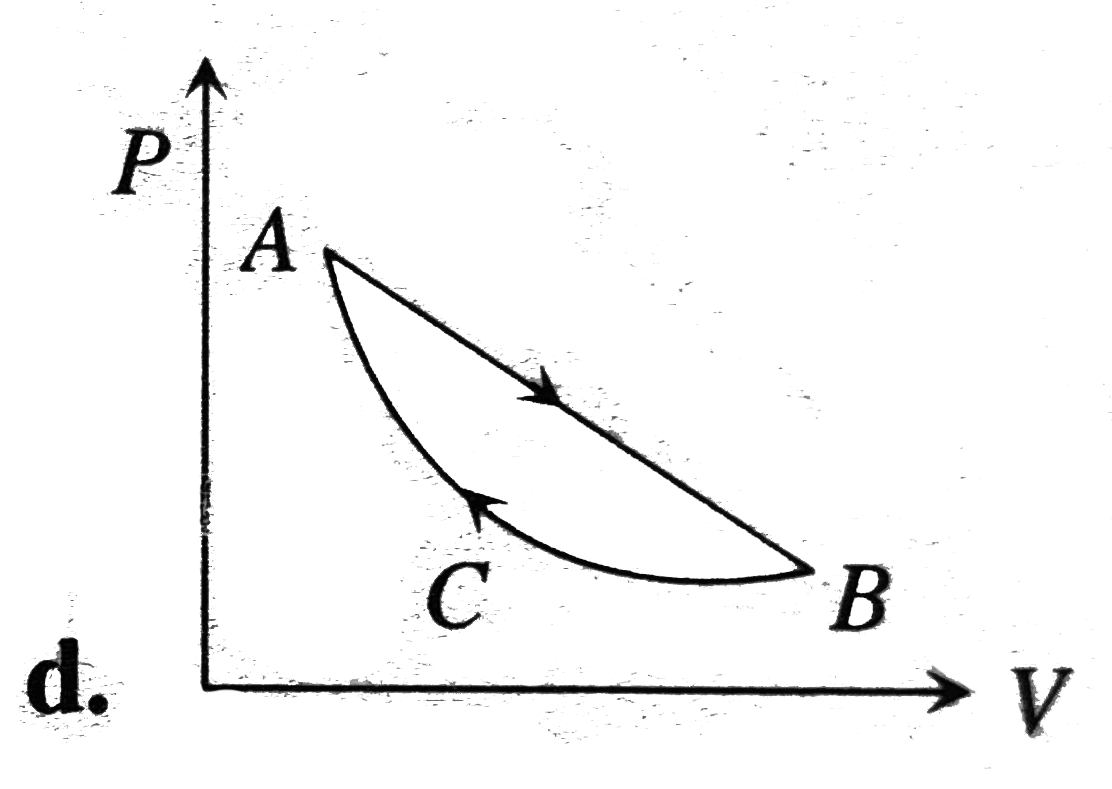
A cyclic process ABCA is shown in the V−T diagram process on the P−V
 A
A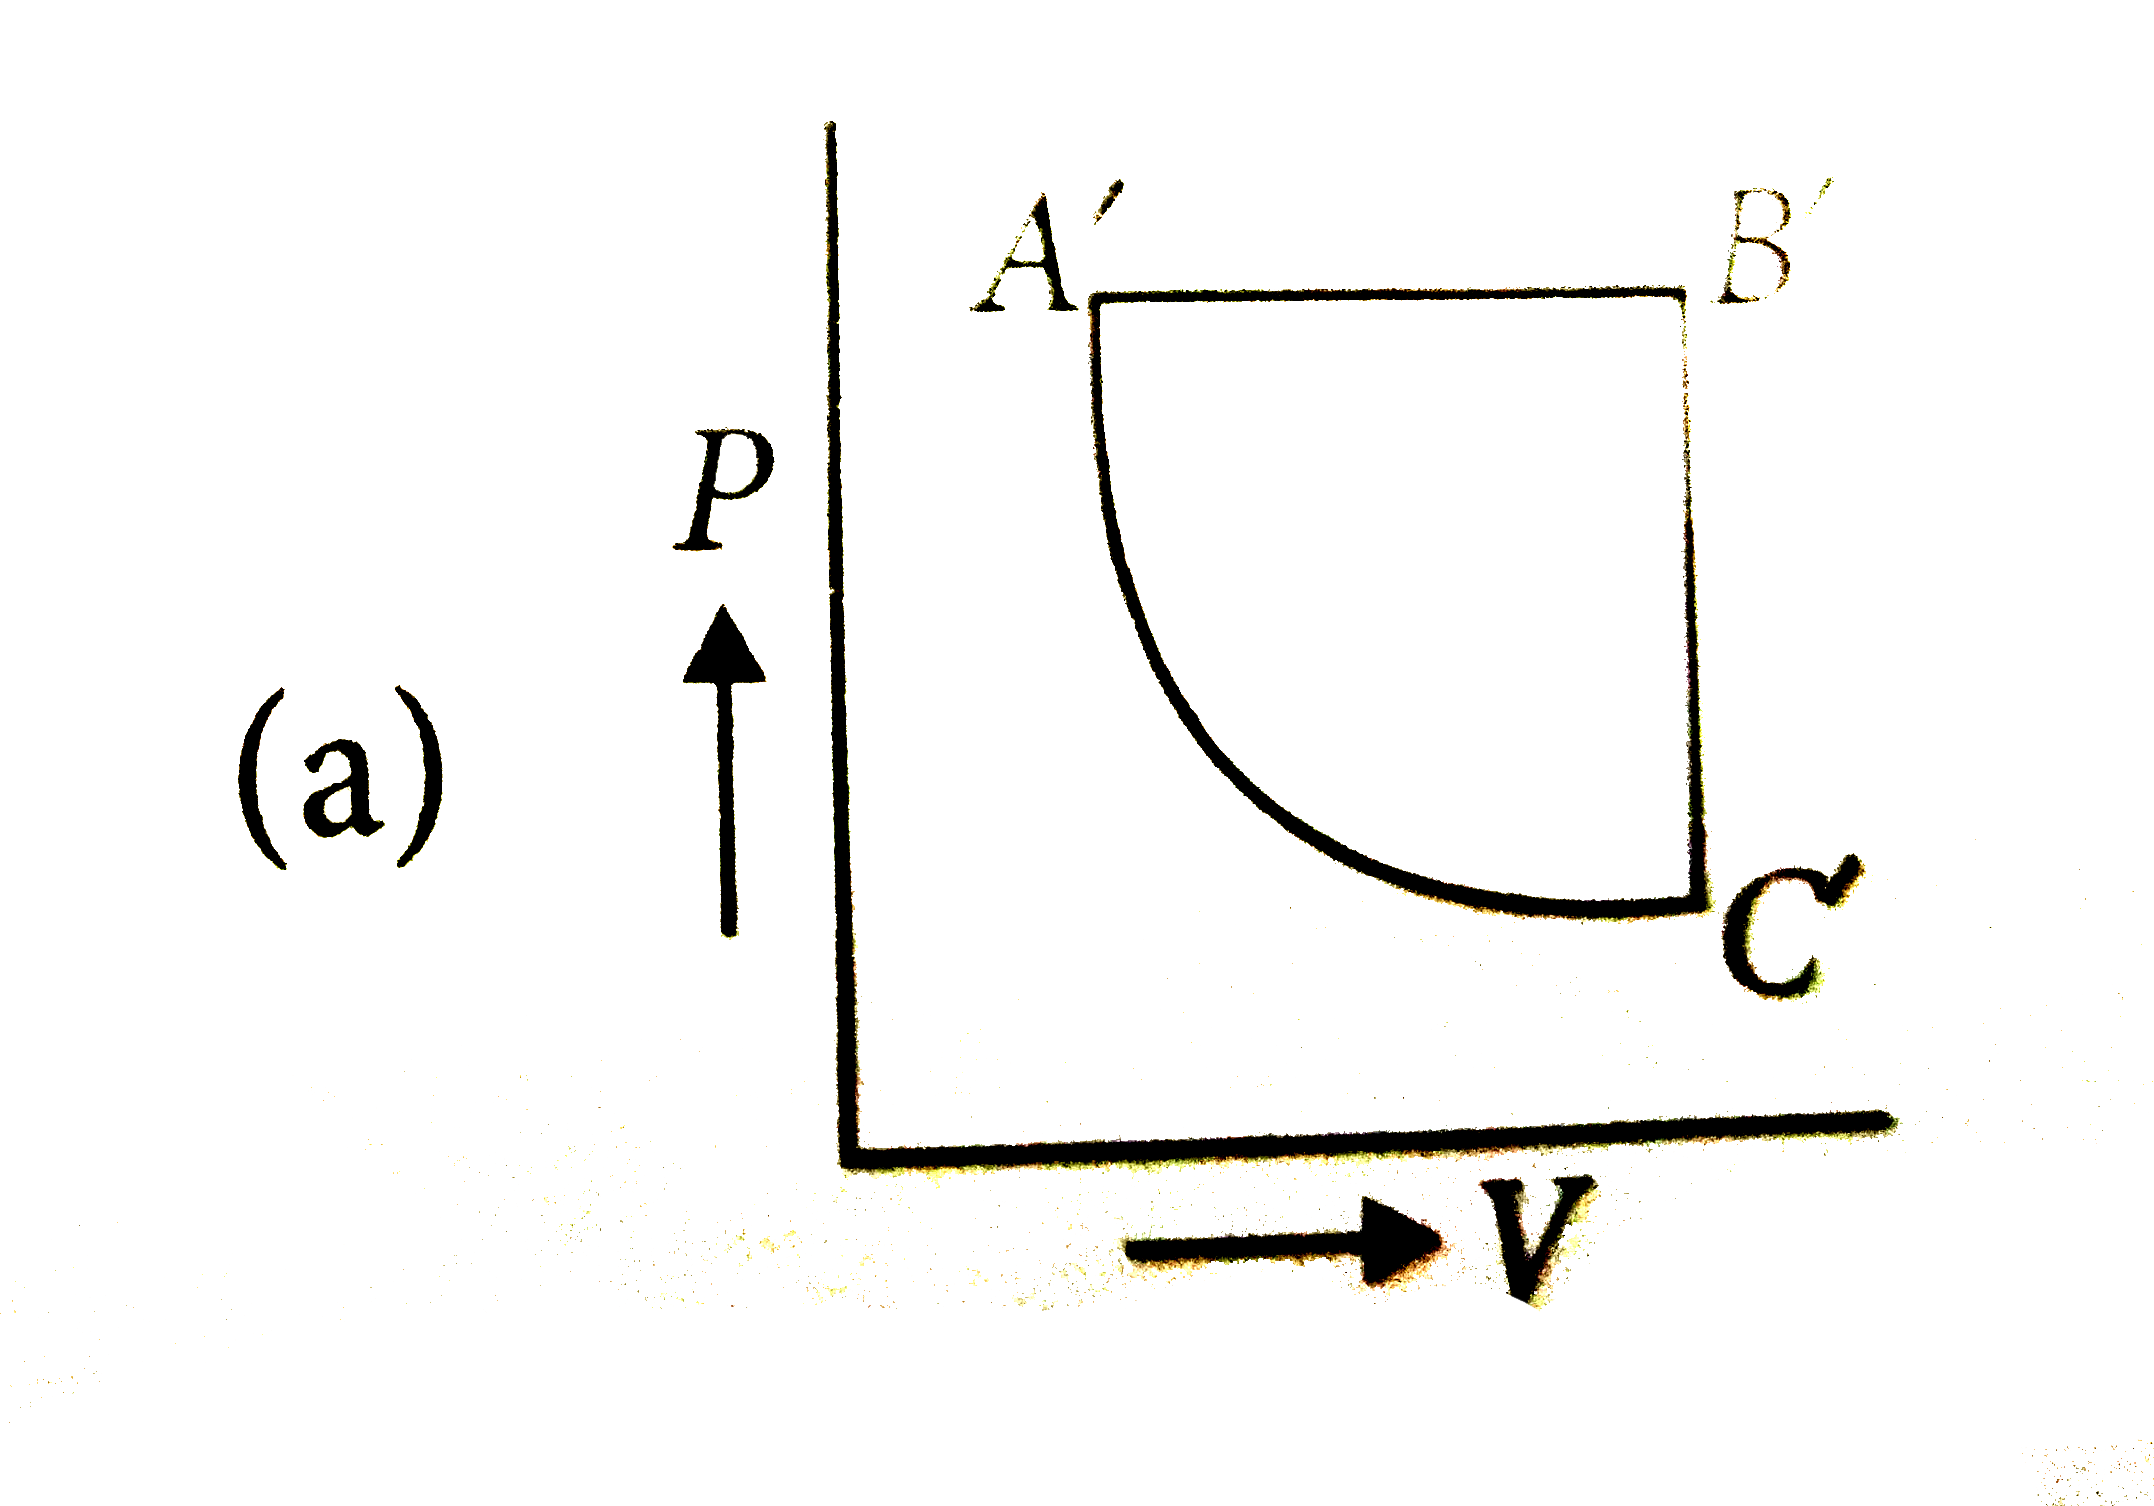 B
B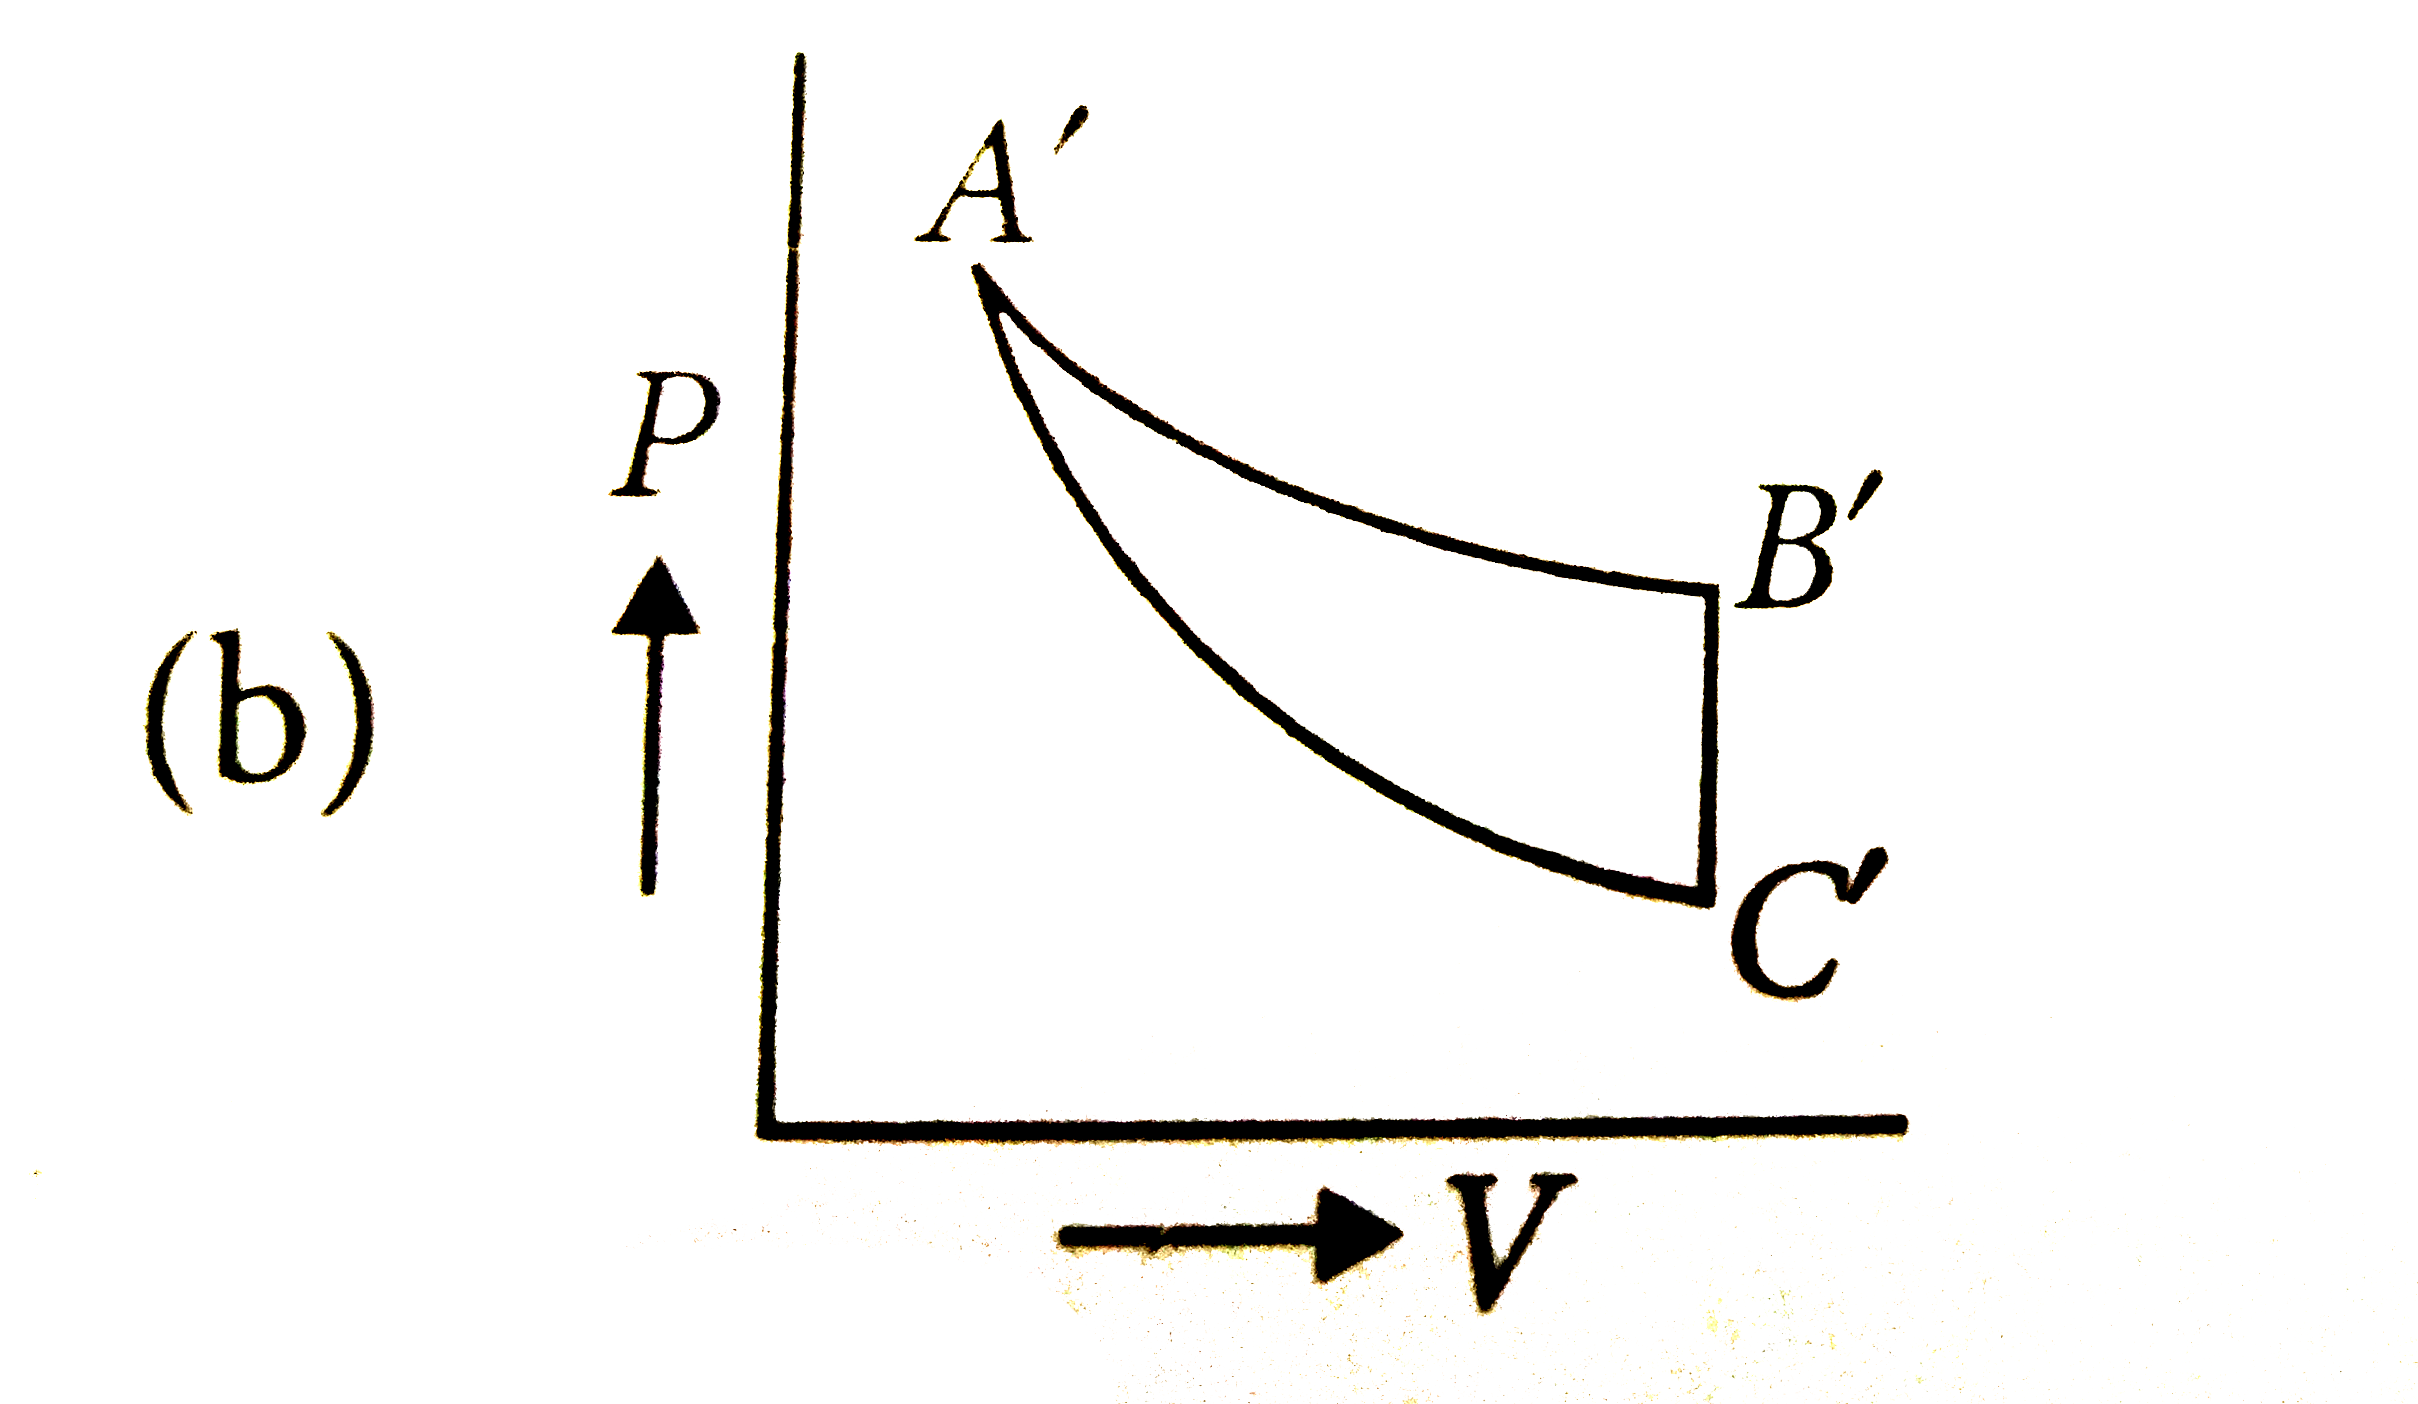 C
C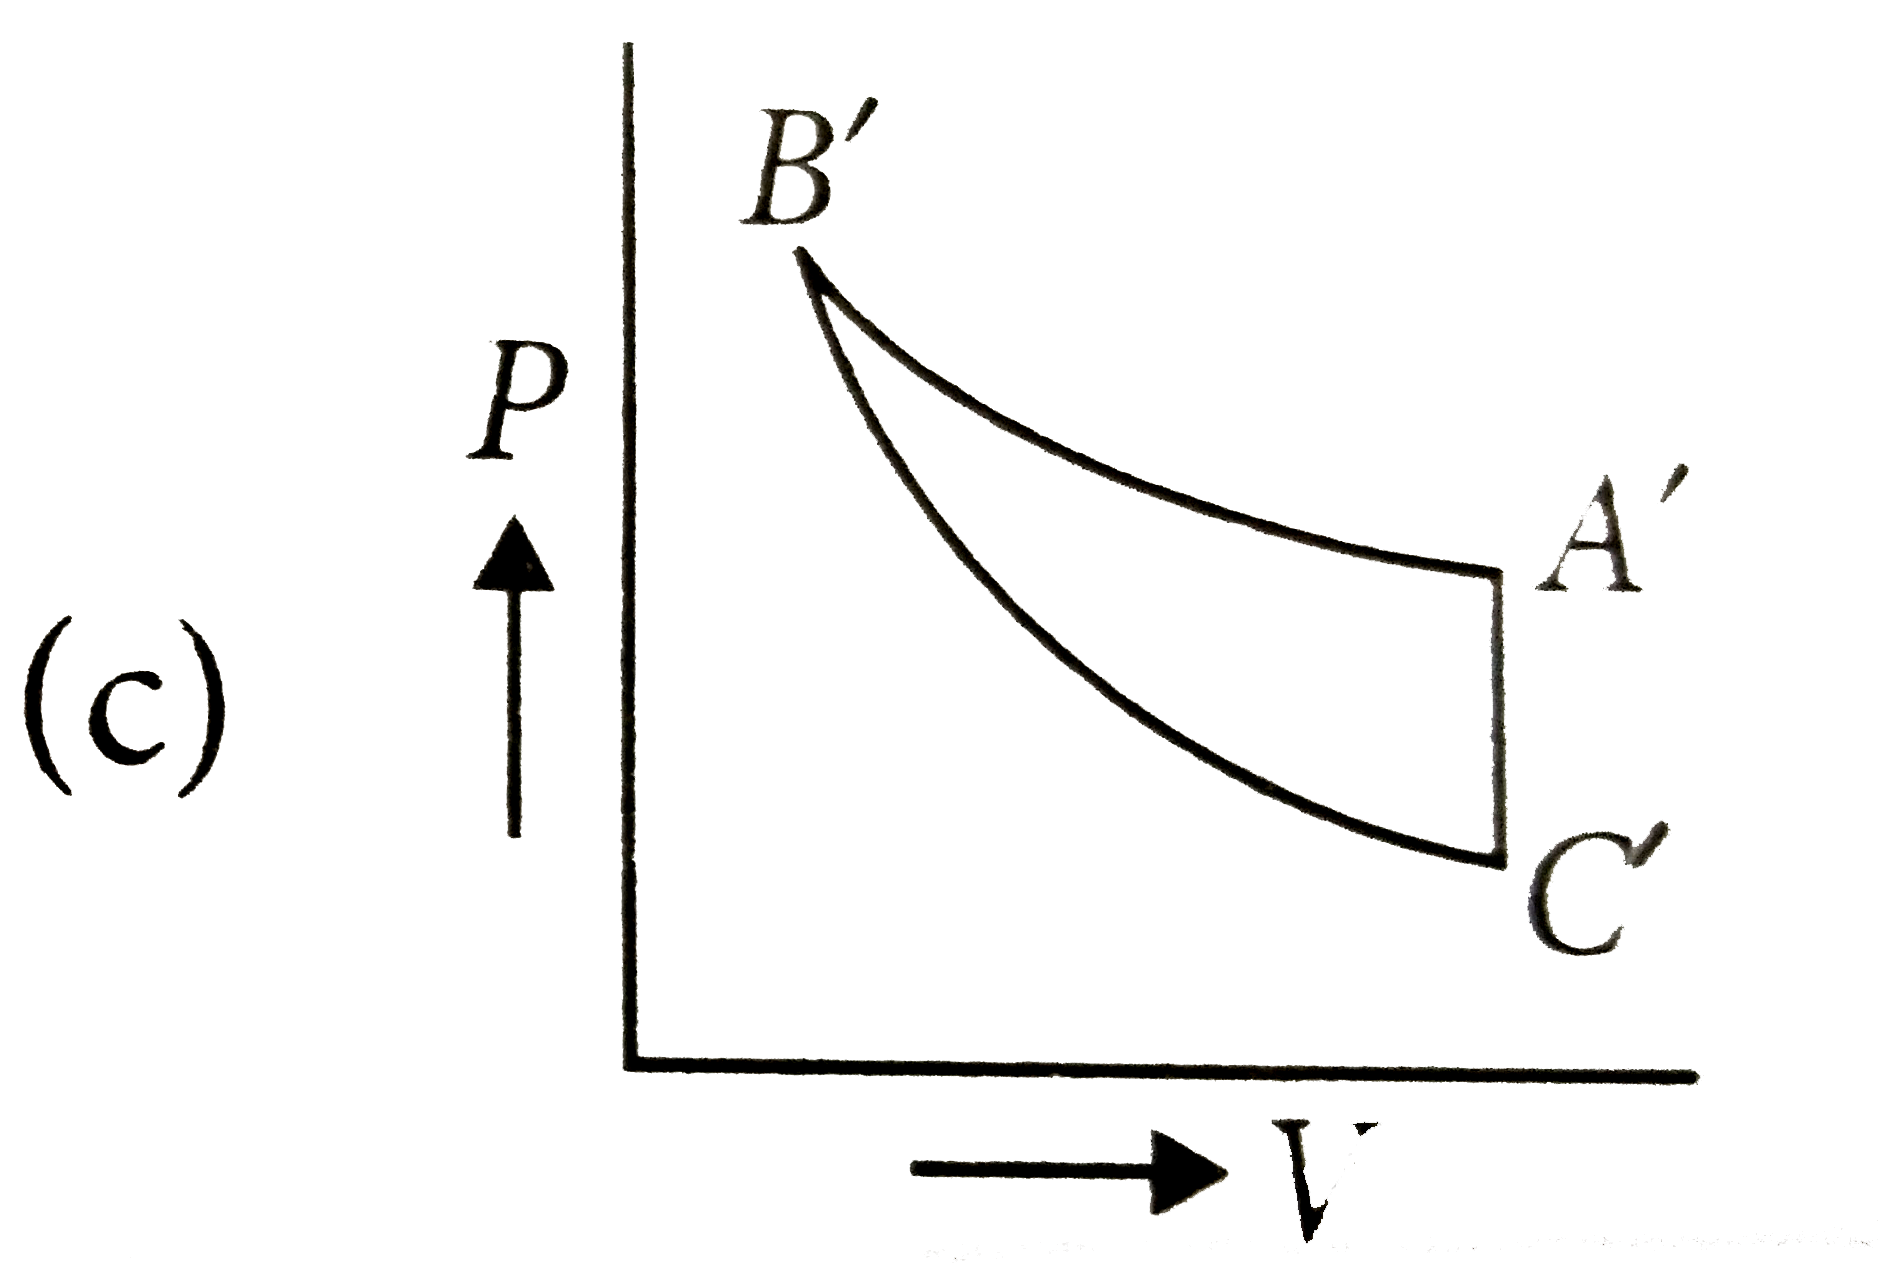 D
D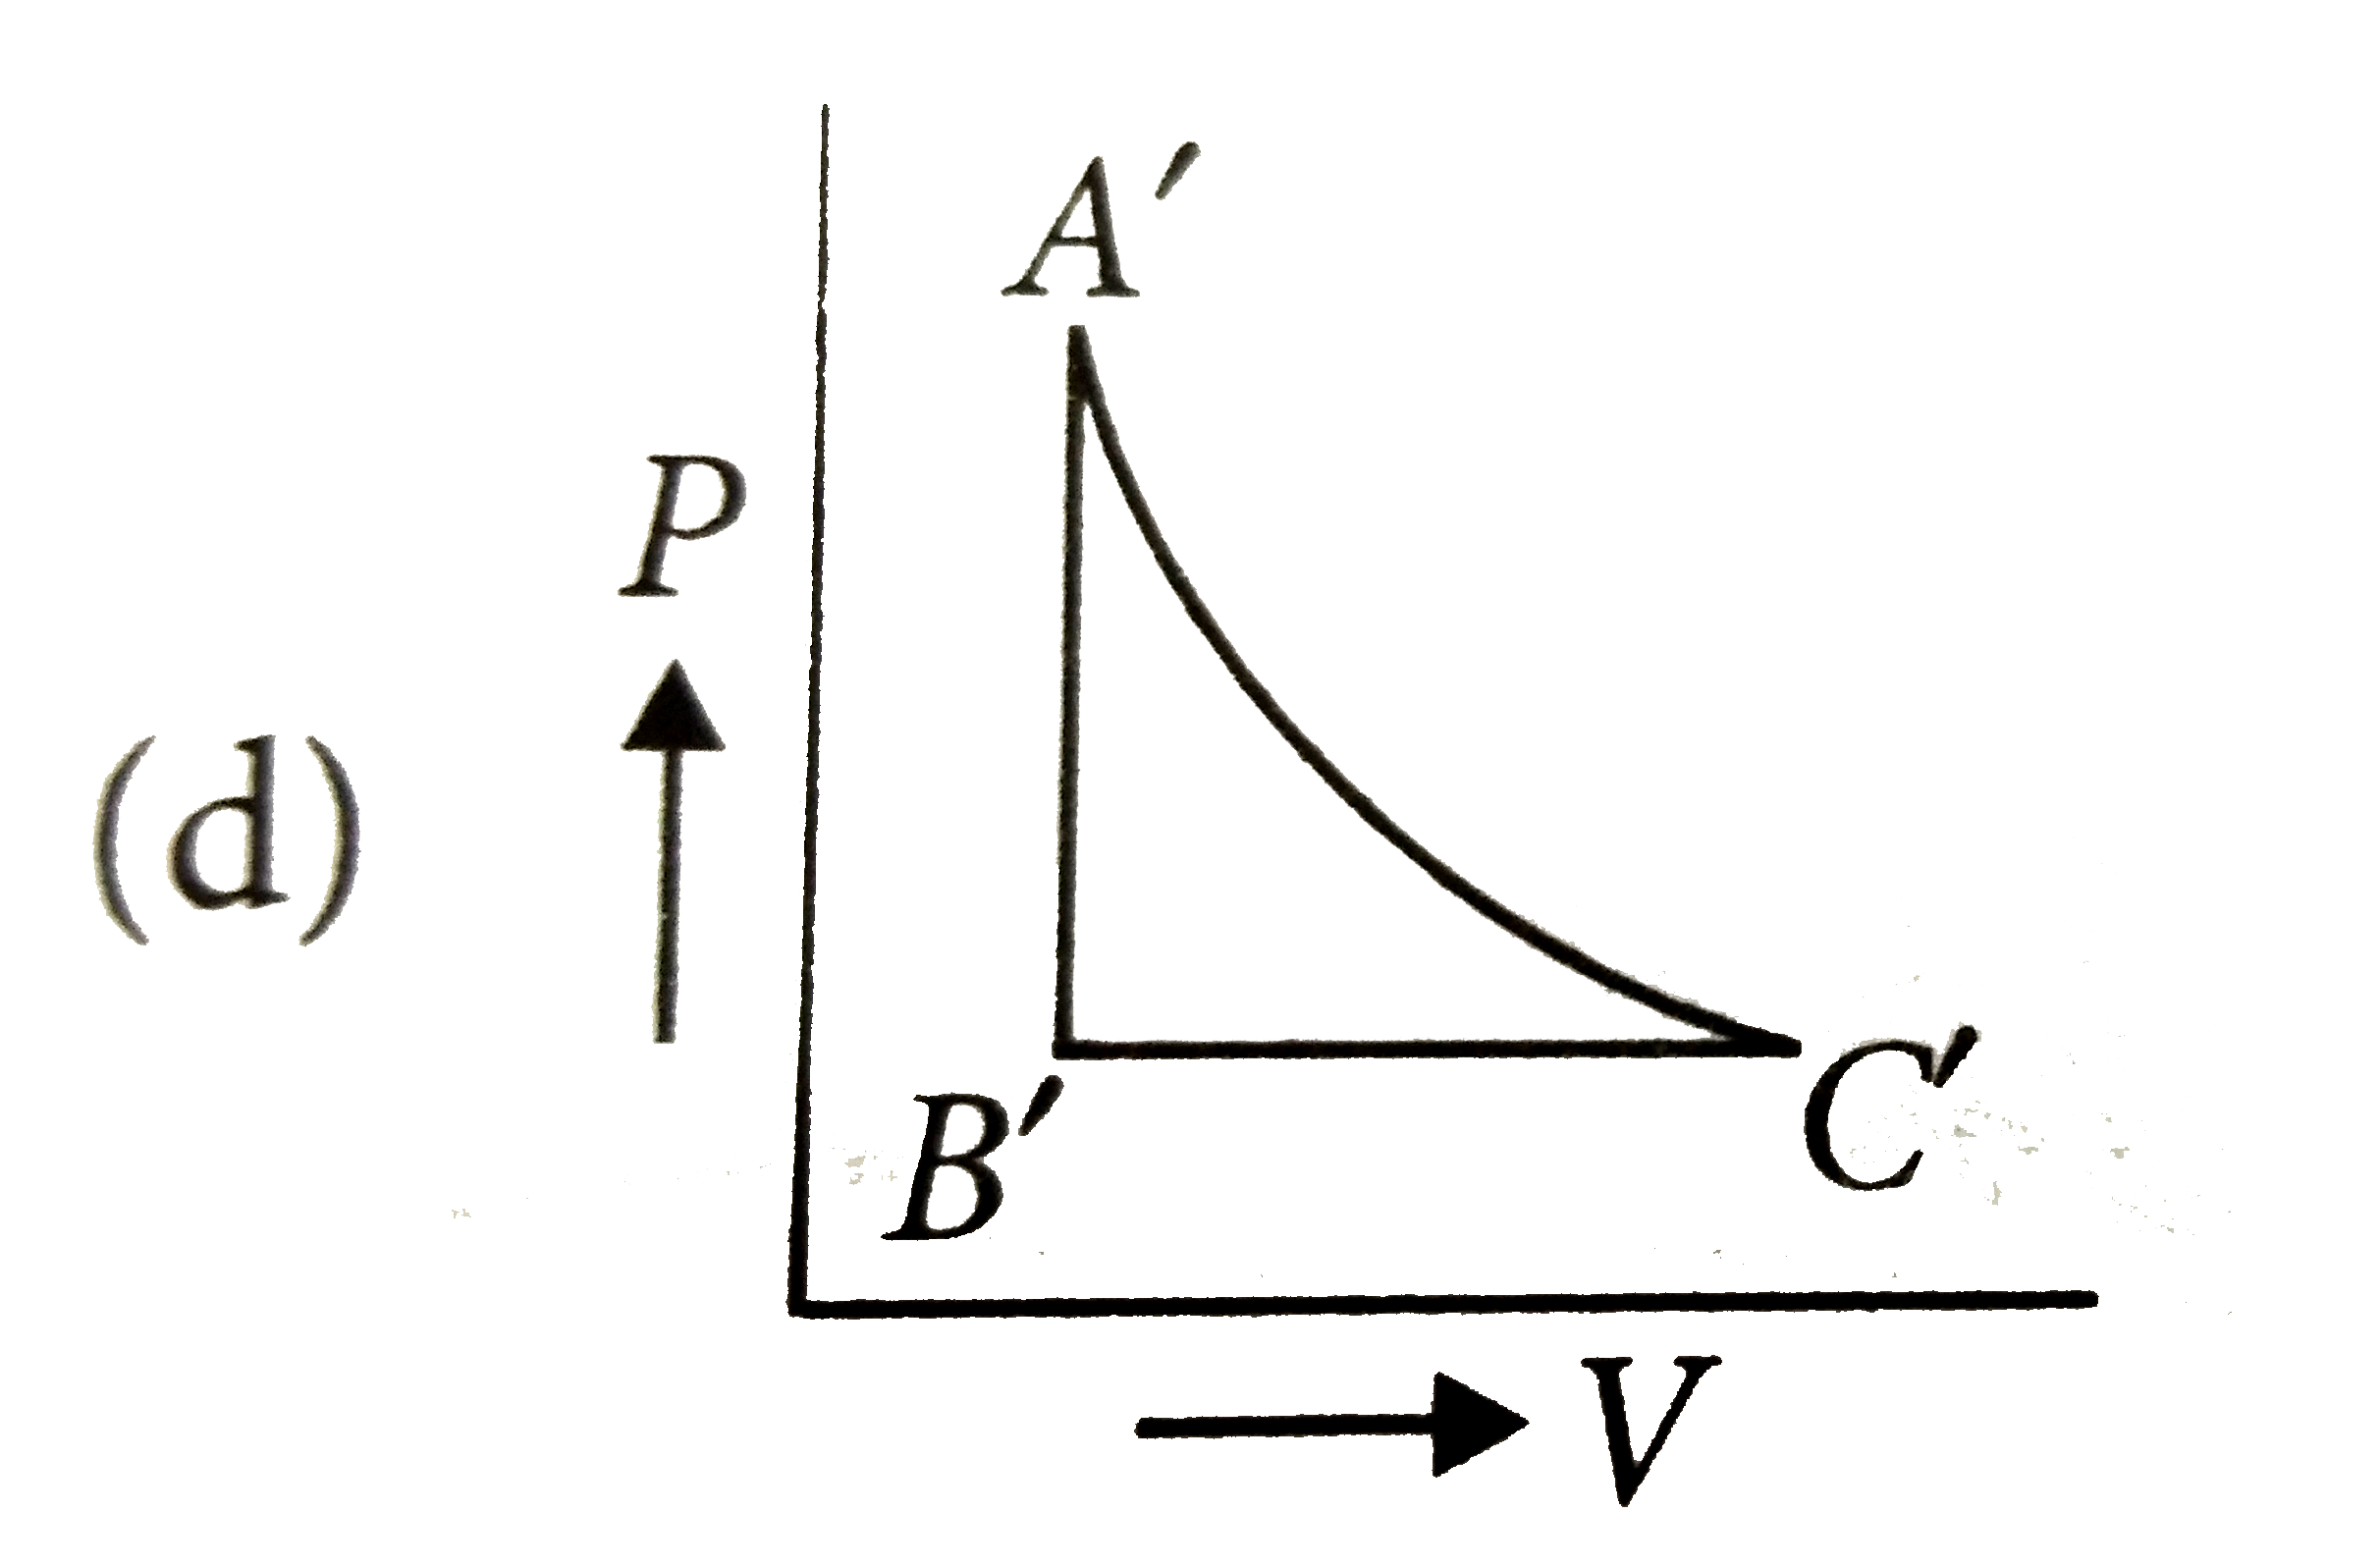
A cyclic process ABCD is shown is shown in the following P−V diagram. Which of the following curves represent the same process ?
 A
A B
B C
C D
D
A cyclic process ABCD is shown is shown in the following P−V diagram. Which of the following curves represent the same process ?

View Solution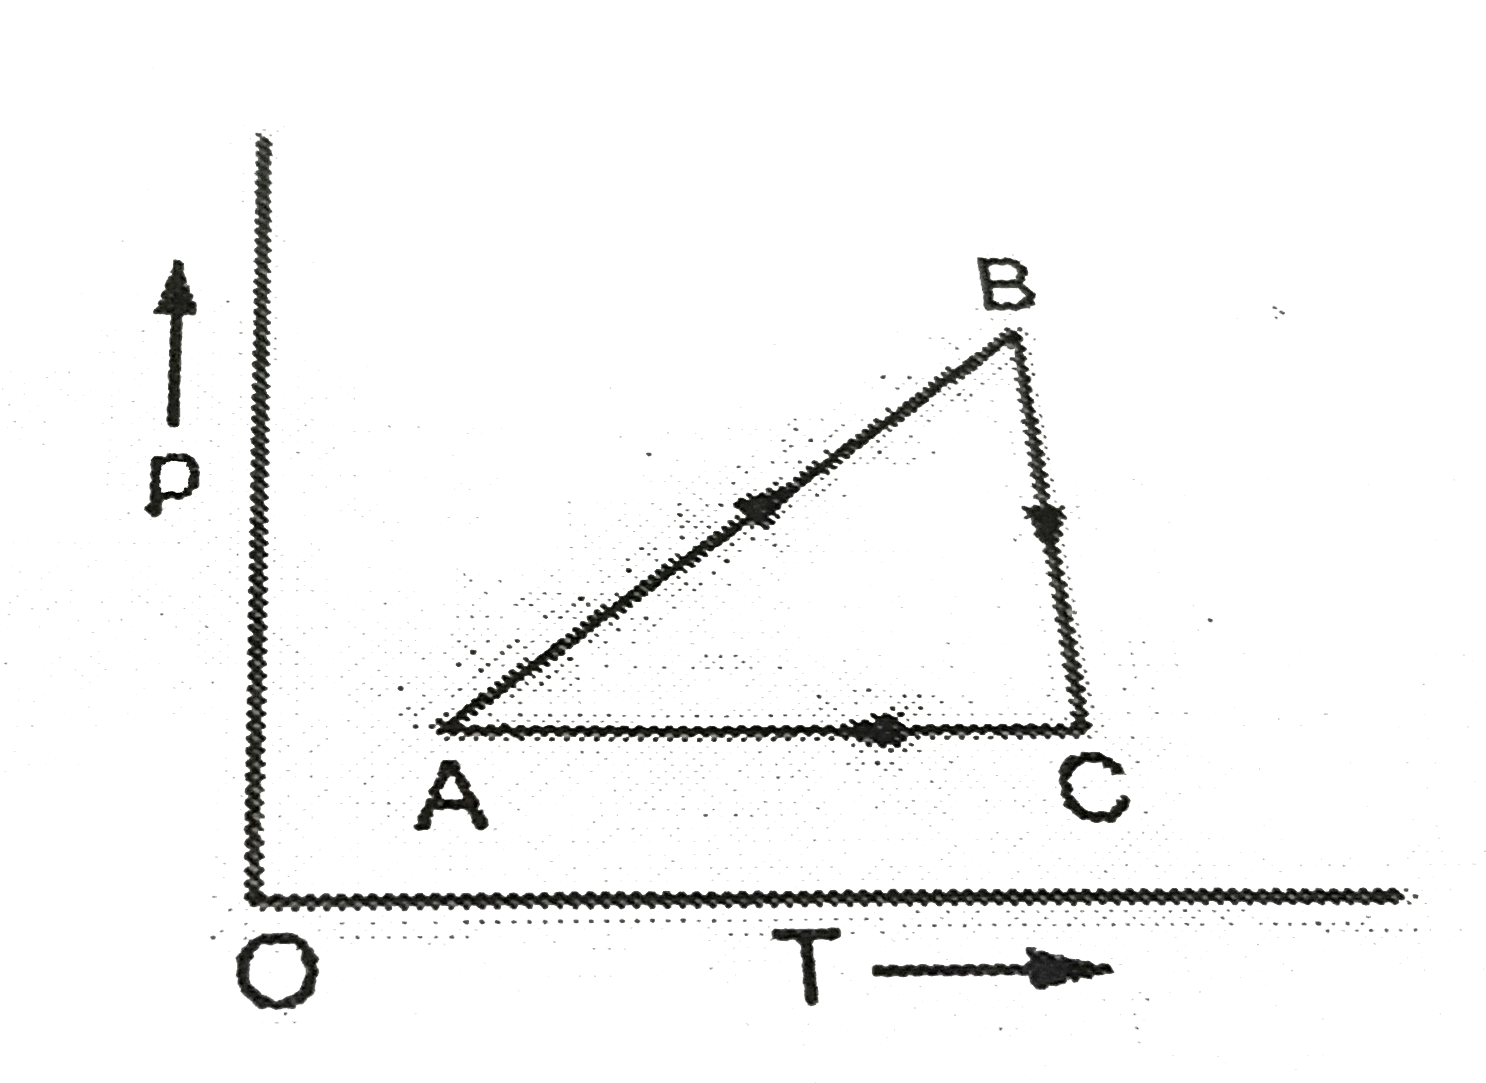
A cyclic process is shown in the p-T diagram. Which of the curves show the same process on a V-T diagram?
View SolutionA cyclic process is shown in the P−T diagram.
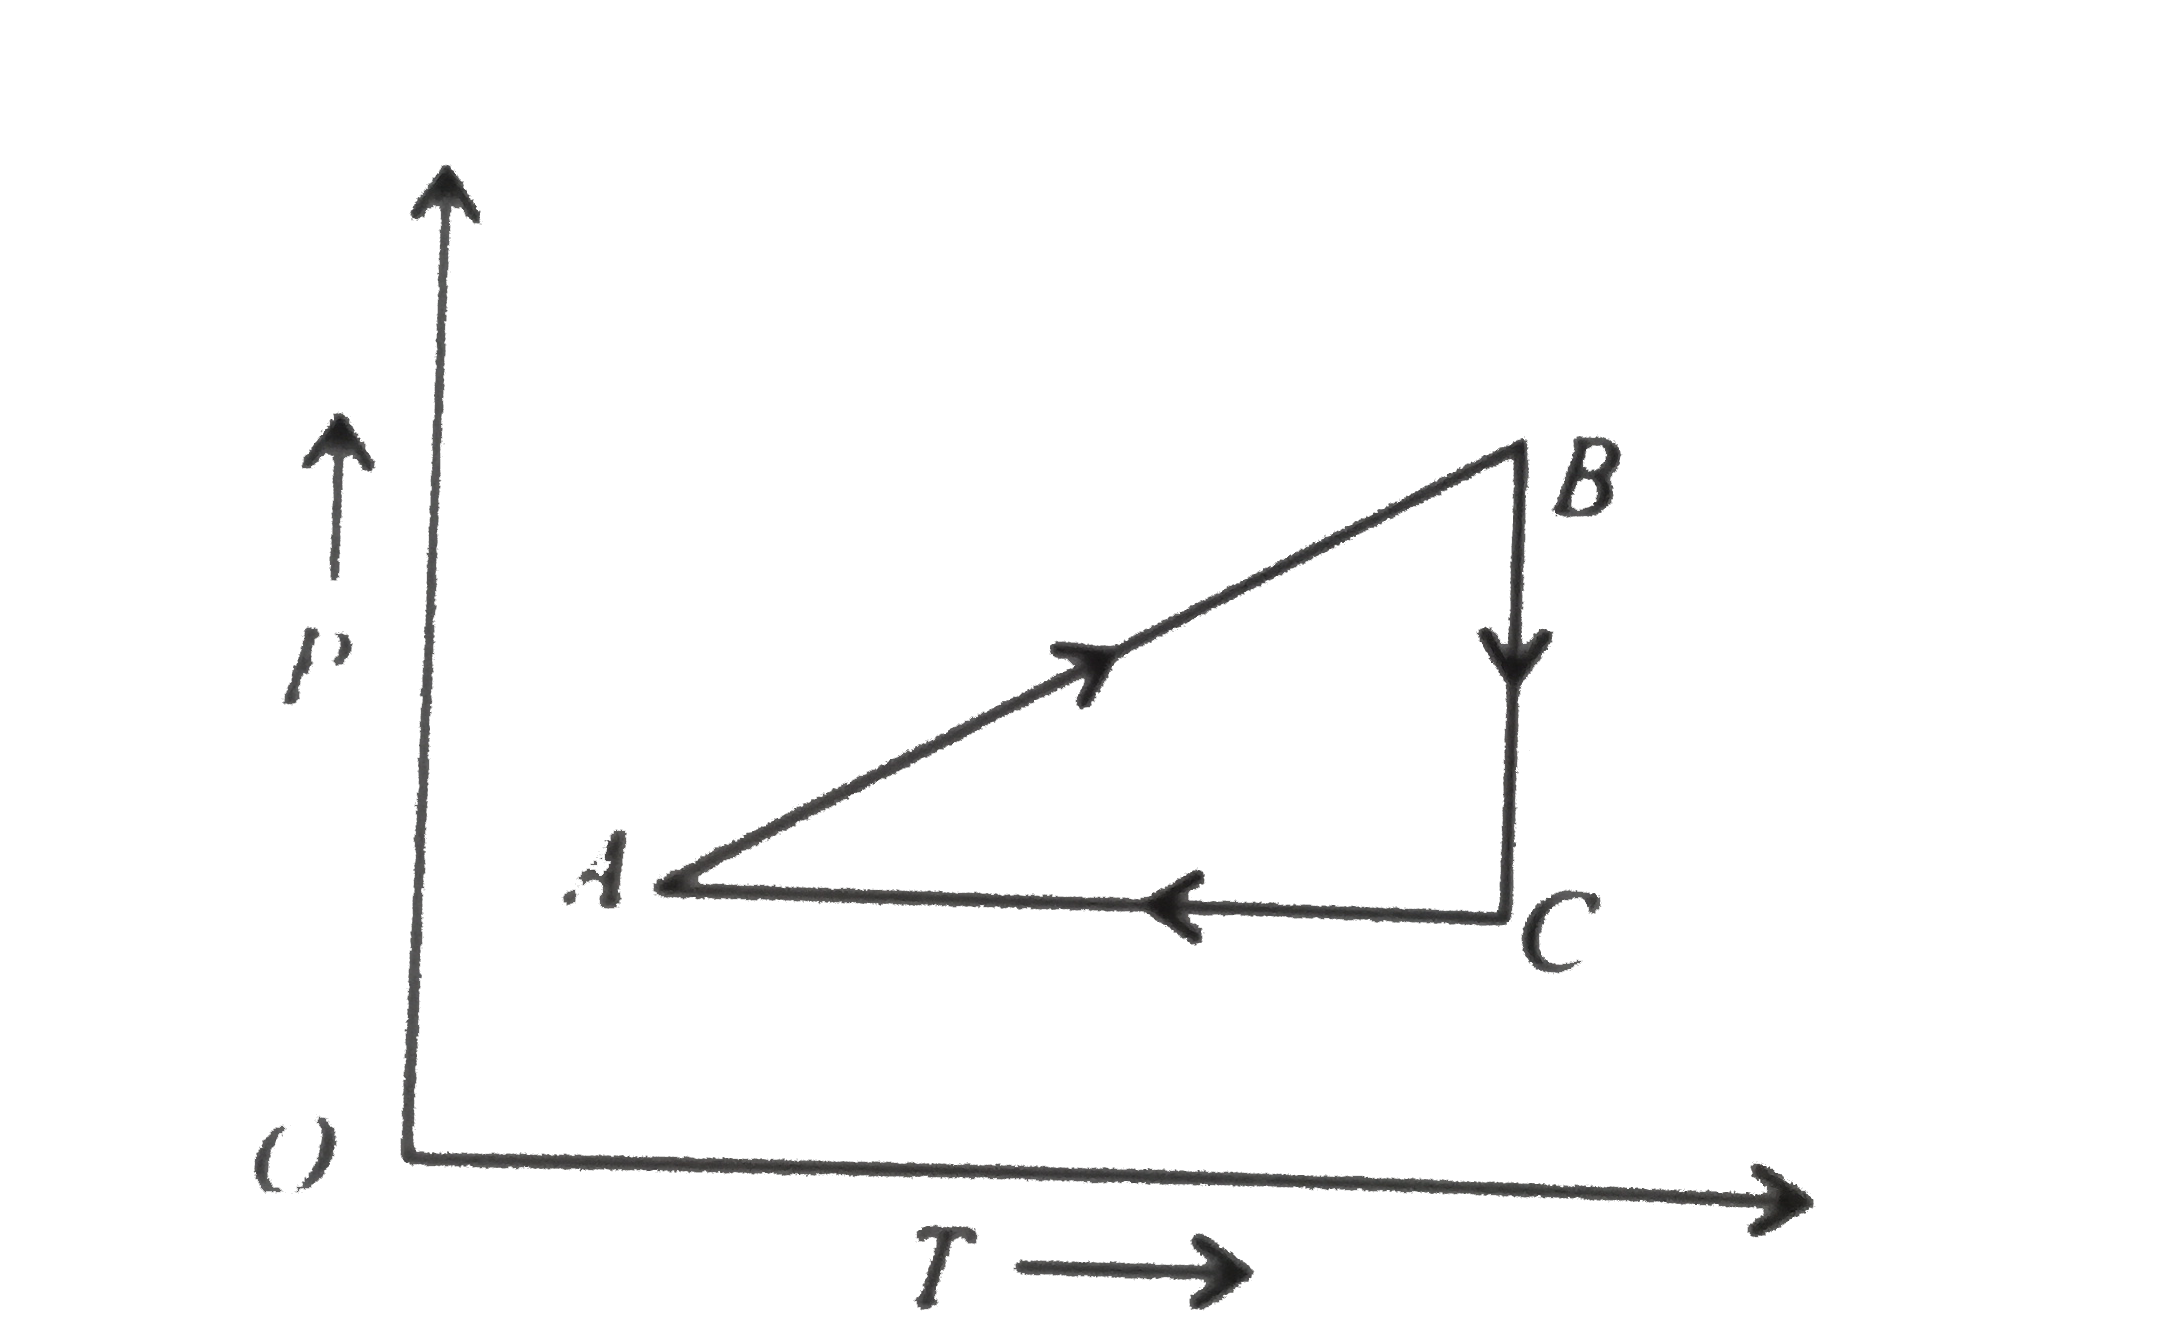
Which of the curve shows the same process on a V−T diagram?
View SolutionA cyclic process is shown in the P−T diagram.

Which of the curve shows the same process on a V−T diagram?
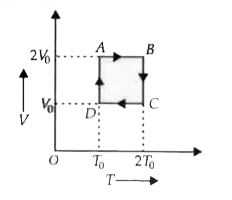
View SolutionOne mole of an ideal gas is taken through a cyclic process as shown in the V-T diagram. Which of the following statements is true ?
View Solution

