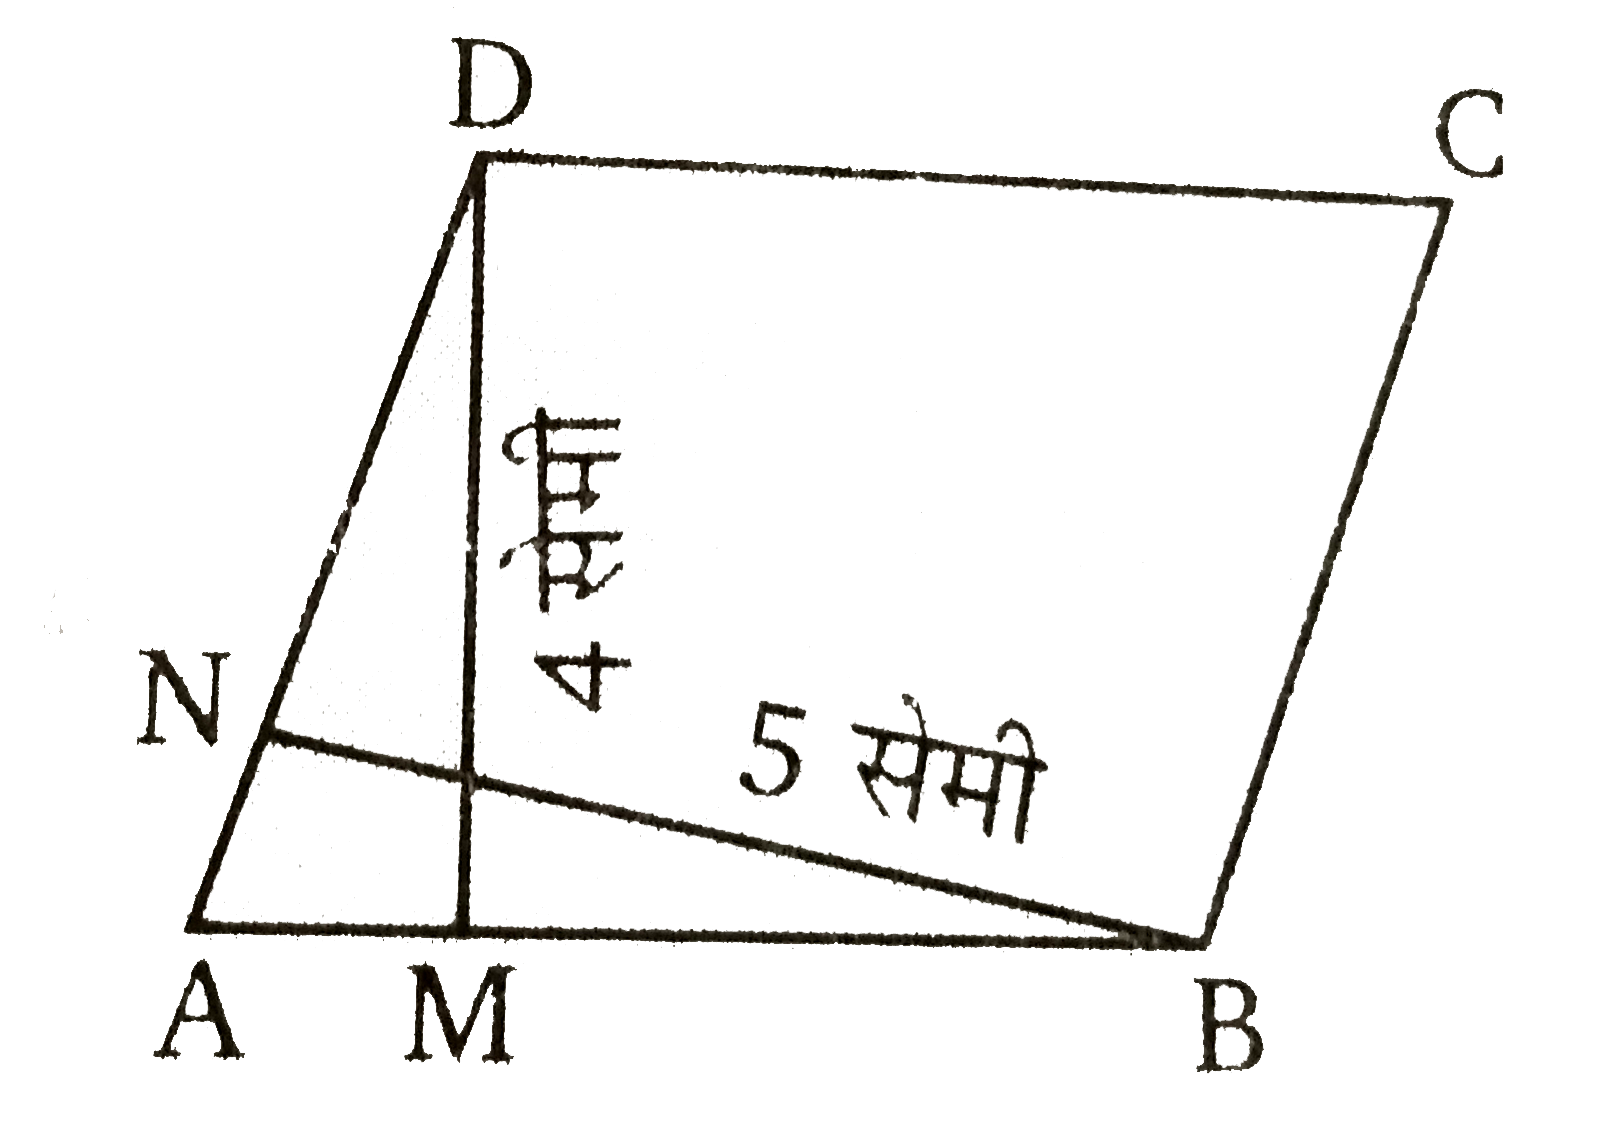
एक समांतर चतुर्भुज ABCD में AB=8 सेमी है। भुजाएं AB व AD के संगत शीर्षलम्ब क्रमशः 4 व 5 सेमी हैं। AD का मान ज्ञात कीजिए।

The correct Answer is:6.4 सेमी
Step by step video, text & image solution for एक समांतर चतुर्भुज ABCD में AB=8 सेमी है। भुजाएं AB व AD के संगत शीर्षलम्ब क्रमशः 4 व 5 सेमी हैं। AD का मान ज्ञात कीजिए। by Maths experts to help you in doubts & scoring excellent marks in Class 9 exams.
Topper's Solved these Questions
- BOOK - S CHANDCHAPTER - क्षेत्रफल EXERCISE - प्रश्नावली 25.11videos
क्षेत्रफल
- BOOK - S CHANDCHAPTER - क्षेत्रफल EXERCISE - प्रश्नावली 25.22videos
क्षेत्रफल
- BOOK - S CHANDCHAPTER - कोण EXERCISE - वस्तुनिष्ठ प्रश्न11videos
कोण
- BOOK - S CHANDCHAPTER - चक्रवृद्धि ब्याजEXERCISE - प्रश्नावली 11.911videos
चक्रवृद्धि ब्याज
Similar Questions
एक समांतर चतुर्भुज ABCD में, AB = 12 सेमी और AB के संगत शीर्षलम्ब =8 सेमी। यदि AD = 12 सेमी तो AD के संगत शीर्षलम्ब ज्ञात करें।
01:37View Solutionएक समचतुर्भुज का क्षेत्रफल ज्ञात करें, जिसके विकर्णों कि लम्बाईयाँ क्रमशः 16 सेमी तथा 124 सेमी हैं।
06:07View Solutionनिम्नलिखित में से प्रत्येक कोण का पूरक निकालें।
32∘16'20''02:11View Solutionकिसी धन पर 2 वर्ष का चक्रवृद्धि ब्याज और साधारण ब्याज क्रमश: 450 रु. तथा 400 रु. हैं । धन और वार्षिक दर प्रतिशत ज्ञात कीजिए ।
01:31View SolutionHow many lines of symmetry does the above figure have ?
02:46View SolutionWhich of the following are correct chain isomers of butane ? (i)
02:45View SolutionDetermine the point of symmetry of a regular hexagon.
02:17View SolutionDtermine the images of the following figure about the given line :
05:41View SolutionIn the figure above (not to scale), ¯¯¯¯¯¯AB⊥¯¯¯¯¯¯CDandAD is the bisector of ∠BAE.AB=3cm and AC=5cm. Find CD.
02:10View SolutionMatch the following Column A to Column B
 02:17View Solution
Match the following Column A to Column B
 02:10View Solution
Match the following Column A to Column B
 04:23View Solution
The inequation represented by the graph given below is :
02:02View SolutionThe inequation that best describes the graph given below is _________
01:13View SolutionThe inequation that best describes the following graph is _________
01:19View SolutionWhich inequations represent the shaded region in the given figure
01:49View Solution
