किसी कंपनी का कुल उत्पादन मूल्य 26,450 रु. था और विभिन्न गतिविधियों पर प्रतिशत व्यय निम्नांकित था- कच्चा मान 64% उपरी व्यय 11% वेतन 15% पैकेजिंग 10% | कच्चे माल पर कुल खर्च था |
16,450 रु.
16,530 रु.
16,928 रु.
17,116 रु.
The correct Answer is:C
Step by step video, text & image solution for किसी कंपनी का कुल उत्पादन मूल्य 26,450 रु. था और विभिन्न गतिविधियों पर प्रतिशत व्यय निम्नांकित था- कच्चा मान 64% उपरी व्यय 11% वेतन 15% पैकेजिंग 10% | कच्चे माल पर कुल खर्च था | by Maths experts to help you in doubts & scoring excellent marks in Class 14 exams.
Updated on:21/07/2023Topper's Solved these Questions
- प्रतिशतBOOK - GHATNA CHAKRACHAPTER - प्रतिशतEXERCISE - अभ्यास प्रश्न
55 Videos
- पाइप एवं टंकी BOOK - GHATNA CHAKRACHAPTER - पाइप एवं टंकी EXERCISE - परीक्षा प्रश्न
16 Videos
- महत्तम समापवर्तक एवं लघुत्तम समापवर्त्य BOOK - GHATNA CHAKRACHAPTER - महत्तम समापवर्तक एवं लघुत्तम समापवर्त्य EXERCISE - परीक्षा प्रश्न
26 Videos
Similar Questions
किसी गाँव की 5,000 लोगो की कुल आबादी में पुरुष 10% बढे और महिलाएं 15%| इस्सके एक वर्ष में कुल आबादी 5,600 हो गई | गाँव में मूलत: महिलाओं की आबादी कितनी थी ?
View Solutionदो पाइपों एक टंकी को क्रमश 3 घंटे और 3 घंटे 45 मिनट में भर सकते है और तीसरा पाइप पूरी टंकी को एक घंटे में खली कर सकता है टंकी आधी भरी हुई है और तीनो पाइप एक साथ खोल दिए जाये तो टंकी कितने समय में खली में खली हो जाएगी
View Solution24 आडू, 36 खूबानी और 60 केले हैं और उन्हें कई पंक्तियों में इस प्रकार रखा जाना है कि प्रत्येक पंक्ति में समान संख्या में केवल एक प्रकार का फल हो। ऐसा करने के लिए पंक्तियों की न्यूनतम संख्या कितनी होनी चाहिए?
View Solutionमुद्रण का जन्म कहाँ पर 868 ई० में हुआ था ?
View Solutionलता मंगेशकर का प्रसिद्ध चित्रपट गायन सर्वप्रथम किरा पर था?
View Solutionमुद्रण' का जन्म कहाँ पर 868 ई० में हुआ था ?
View SolutionA party was held for 50 people on their own expenses. Out of them, 48 people paid Rs. 950 each and the other two persons paid Rs. 1200 more than the average expenses of the group. The total amount spent was :
50 लोगों के लिए एक पार्टी का आयोजन उन्हीं के खर्चे पर किया गया | उनमें से 48 लोगों ने, प्रत्येक ने,रु 950 का भुगतान किया, जबकि अन्य दो ने समूह के औसत व्यय से रु 1200 अधिक का भुगतान किया | खर्च किया गया कुल व्यय था :
View SolutionSushma bought 6 tables and 12 chairs for Rs.12000. She sold the tables at a profit of 15% and the chairs at a loss of 10%. If her total gain was 300, then the total cost of the tables was:
सुषमा ने 6 मेज और 12 कुर्सियों को 12000 रुपये में क्रय किया | उसने मेजों को 15% लाभ पर तथा कुर्सियों को 10% हानि पर बेच दिया | यदि उसका कुल लाभ 300 था, तो मेजों की कुल कीमत ज्ञात करें |
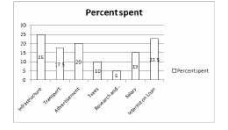
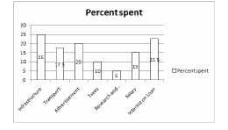
View SolutionThe given graph represents the percentage distribution of the total expenditure of a company. Study the graph and answer the question that follows.
दिया गया आरेख एक कंपनी के कुल व्यय के प्रतिशत वितरण को दर्शाता है। आरेख का अध्ययन कीजिए और फिर पूछे गए प्रश्न का उत्तर दीजिए। What is the ratio of the total expenditure on .Infrastructure. and .Transport. to the total expenditure on .Taxes. and .Interest on Loans.?
‘आधारभूत संरचना’(Infrastructure) तथा “परिवहन. (Transport) पर किये गए कुल व्यय और “करों (Taxes) तथा “ऋण पर ब्याज.(Interest on loans) पर किये गए कुल व्यय के बीच अनुपात ज्ञात कीजिए।
View SolutionThe given graph represents the percentage distribution of the total expenditure of a company. Study the graph and answer the question that follows.
दिया गया आरेख एक कंपनी के कुल व्यय के प्रतिशत वितरण को दर्शाता है। आरेख का अध्ययन कीजिए और फिर पूछे गए प्रश्न का उत्तर दीजिए। The total expenditure of the company is how many times the total expenditure on .Research
and Development. and .Salary.?
कंपनी का कुल व्यय .शोध तथा विकास (Reaserch and Development)’ और .वेतन.(Salary) पर किये गए कुल व्यय से कितना गुना है ?
View SolutionThe given graph represents the percentage distribution of the total expenditure of a company. Study the graph and answer the question that follows.
दिया गया आरेख एक कंपनी के कुल व्यय के प्रतिशत वितरण को दर्शाता है। आरेख का अध्ययन कीजिए और फिर पूछे गए प्रश्न का उत्तर दीजिए। The expenditure on .Interest on loans. is what percentage more than the expenditure on
.Transport.?
.ऋण पर ब्याज. (Interest on loans) में किया गया व्यय “परिवहन (Transport) पर किये गए व्यय से कितना प्रतिशत अधिक है ?
View SolutionStudy the graph and answer the questions based on the graph:
आरेख का अध्ययन करें और आरेख के आधार पर प्रश्नों के उत्तर दें: On which day the production was 1/5 th of the total production?
किस दिन उत्पादन कुल उत्पादन का 1/5 था?
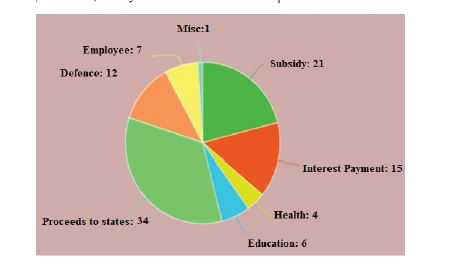
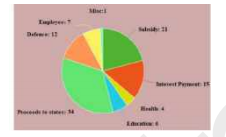
View SolutionThe following pie chart shows percentage expenditure of a country on different heads. The total expenditure is Rs.1,680 (in billions). Study the chart and answer the questions
निम्नलिखित पाई चार्ट अलग-अलग प्रमुखों पर किसी देश का प्रतिशत व्यय दर्शाता है। कुल खर्च रु1,680 (अरबों में)। चार्ट का अध्ययन करें और प्रश्नों का उत्तर दें | The central angle of the sector representing expenditure on subsidy is :
सब्सिडी पर व्यय का प्रतिनिधित्व करने वाले क्षेत्र का केंद्रीय कोण ज्ञात करे |
View SolutionThe following pie chart shows percentage expenditure of a country on different heads. The total expenditure in Rs. 1,680(in billion). Study the chart and answer the question.
निम्नलिखित पाई चार्ट अलग-अलग प्रमुखों पर किसी देश का प्रतिशत व्यय दर्शाता है। 1,680 (बिलियन में) कुल खर्च। चार्ट का अध्ययन करें और प्रश्न का उत्तर दें।
The expenditure on Education is what percentage less than the expenditure on defence ?
शिक्षा पर व्यय रक्षा पर व्यय से कितना प्रतिशत कम है |
View SolutionThe following pie chart shows percentage expenditure of a country on different heads. The total expenditure in Rs. 1,680(in billion). Study the chart and answer the question.
निम्नलिखित पाई चार्ट अलग-अलग प्रमुखों पर किसी देश का प्रतिशत व्यय दर्शाता है। 1,680 (बिलियन में) कुल खर्च। चार्ट का अध्ययन करें और प्रश्न का उत्तर दें।
The central angle of the sector representing expenditure on interest payment is:
ब्याज भुगतान पर व्यय का प्रतिनिधित्व करने वाले क्षेत्र का केंद्रीय कोण है
View SolutionThe given Bar Graph presents Income and Expenditure (in crores of Rupees) of a company for five years, 2014 to 2018. What is the ratio of total Expenditure to total Income of the company in 2014,2016 and 2017? दिया गया दंड आरेख (बार ग्राफ) 5 वर्षों, 2014 से 2018 के दौरान किसी कंपनी की आय और व्यय (करोड़ रुपए में) को दर्शाता है| 2014, 2016 और 2017 में कंपनी के कुल व्यय और कुल आय का अनुपात क्या है?
View Solution
