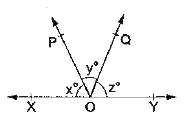
संलग्न आकृति में,x:y:z = 5:4:6. यदि XOY एक ऋजु रेखा है, तो x,y तथा z के मान ज्ञात कीजिए।

The correct Answer is:x=60, y=48, z=72,
Step by step video & image solution for संलग्न आकृति में,x:y:z = 5:4:6. यदि XOY एक ऋजु रेखा है, तो x,y तथा z के मान ज्ञात कीजिए। by Maths experts to help you in doubts & scoring excellent marks in Class 9 exams.
Updated on:21/07/2023Topper's Solved these Questions
- रेखाएँ और कोण BOOK - BHARATI BHAWANCHAPTER - रेखाएँ और कोण EXERCISE - प्रश्नमाला 7C
16 Videos
- रेखाएँ और कोण BOOK - BHARATI BHAWANCHAPTER - रेखाएँ और कोण EXERCISE - प्रश्नमाला 7D (बहुवैकल्पिक प्रश्न)
21 Videos
- रेखाएँ और कोण BOOK - BHARATI BHAWANCHAPTER - रेखाएँ और कोण EXERCISE - प्रश्नमाला 7A
27 Videos
- यूक्लिड की ज्यामिति का परिचय BOOK - BHARATI BHAWANCHAPTER - यूक्लिड की ज्यामिति का परिचय EXERCISE - प्रश्नमाला 6B (बहुवैकल्पिक प्रश्न सही विकल्प का चयन करें)
17 Videos
- वृत्त BOOK - BHARATI BHAWANCHAPTER - वृत्त EXERCISE - प्रश्नगाला 12D (बहुवैकल्पिक प्रश्न)
14 Videos
Similar Questions
यदि एक तिर्यक रेखा दो समांतर रेखाओं को प्रतिच्छेद करती है, तो कोणों के कौन-से युग्म बराबर होते हैं?
View Solutionदी गई आकृति में x का मान है

View Solutionनिम्नांकित प्रत्येक पद की परिभाषा लिखिए-
कोण
View Solutionदो तलों के एक-दूसरे को काटने पर बनता है
View Solution13 cm त्रिज्या वाले वृत्त की एक जीवा की लंबाई 10 cm है। वृत्त के केंद्र से उस जीवा की दूरी है
View SolutionHow many lines of symmetry does the above figure have ?
View SolutionWhich of the following are correct chain isomers of butane ? (i)
View SolutionDetermine the point of symmetry of a regular hexagon.
View SolutionDtermine the images of the following figure about the given line :
View SolutionMatch the following Column A to Column B

View SolutionMatch the following Column A to Column B

View SolutionMatch the following Column A to Column B

View SolutionThe inequation represented by the graph given below is :
View SolutionThe inequation that best describes the graph given below is _________
View SolutionThe inequation that best describes the following graph is _________
View SolutionWhich inequations represent the shaded region in the given figure
View Solution
