The B-H curve (i) and (ii) shown in the figure is associated with
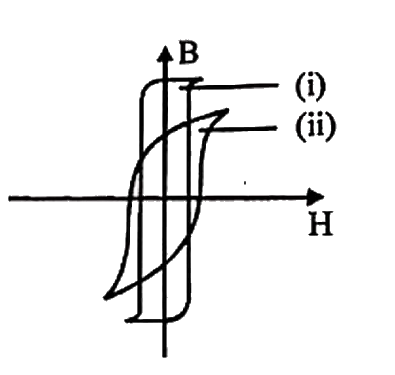
(i) diamagnetic and (ii) paramagnetic substance
(i) paramagnetic and (ii) ferromagnetic substance
(i) soft iron and (ii) steel respectively
(i) steel and (ii) soft iron respectively.
The correct Answer is:C
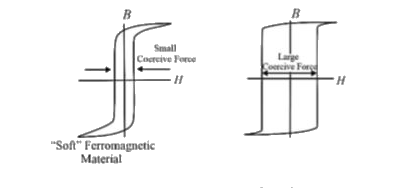
From the hysteresis curve of soft iron we know soft iron has high retentivity and low coercive force therefore the loop (i) is for soft iron and the loop (ii) is for steel.
Topper's Solved these Questions
Similar Questions
The B-H curve for a ferromagnet is shown in the figure. The ferromagnet is placed inside a long solenoid with 1000 turns/cm. The current that should be passed in the solenoid to demagnetise the ferromagnet completely is :
 View Solution
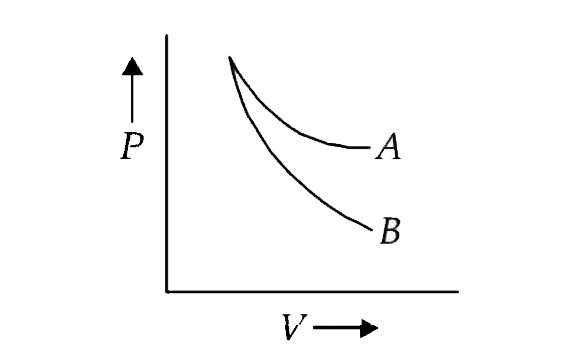
The curves A and B in the figure shown P-V graphs for an isothermal and an adiabatic process for an idea gas. The isothermal process is represented by the curve A.
 View Solution
Knowledge Check
- Question 1 - Select One
A and B shown in the figure arc
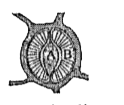 AEpidermis and Guard cell,BGuard cell and Cuticle,CStomatal pore and Guard cell,DEpidermis and Pore.
 - Question 2 - Select One
The B-H curves (a) and (b) drawn below are associated with :
 Aa diamagnetic and a ferromagnetic substance respectivelyBa paramagnetic and a ferromagnetic substance respectivelyCsoft iron and steel respectivelyDsteel and soft iron respectively
 - Question 3 - Select One
The dissociation curve is associated with
AOxygenBOxyhaemoglobinCCarbon dioxideDCarbonic anhydrase
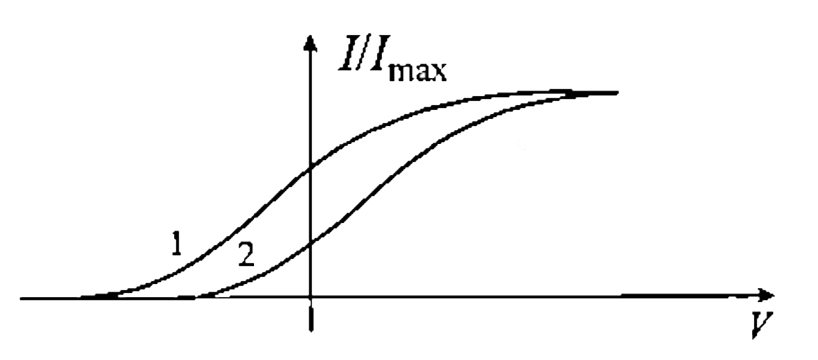
Two photocathodes are illuminated by the light emitted by a single source. The dependence of photocurrent versus voltages between cathode and anode is shown by curves 1 and 2 as shown in the figure. (I/I_(max) represents ratio of photocurrent to saturation current):
 View Solution
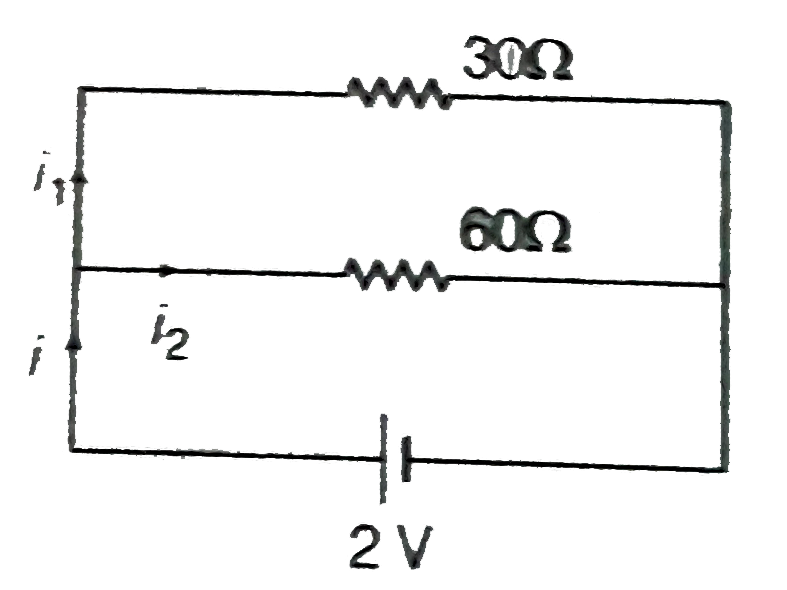
Find i in shown figure.
 View Solution
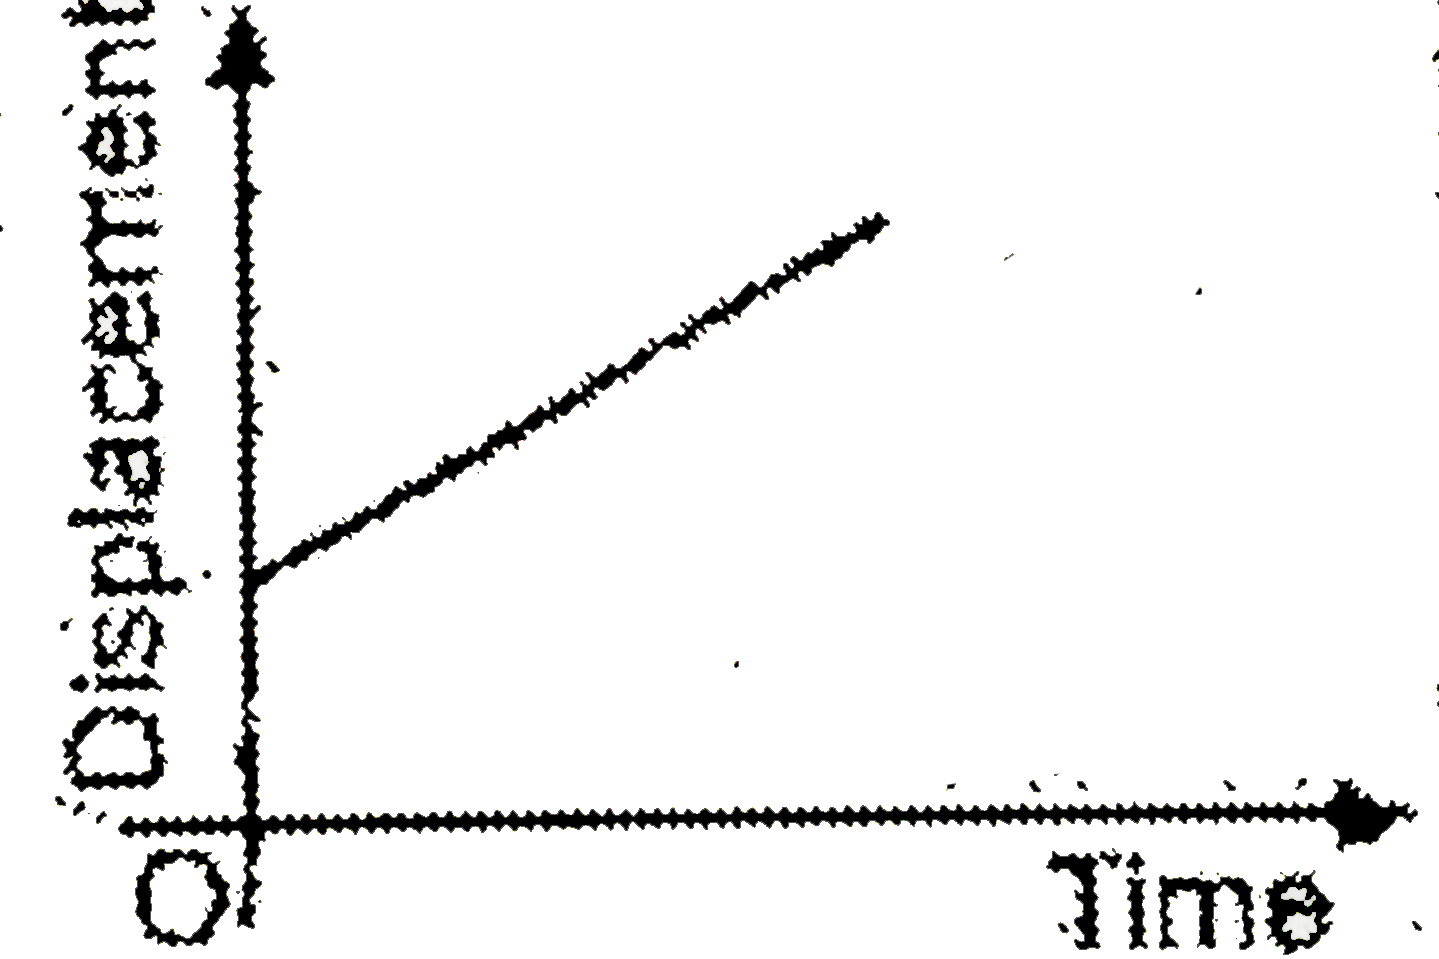
The displacement time curve of a particle is shown in the figure. The external force acting on the particle is :
 View Solution
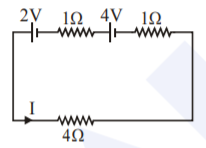
For the circuit shown in the figure current I will be
 View Solution
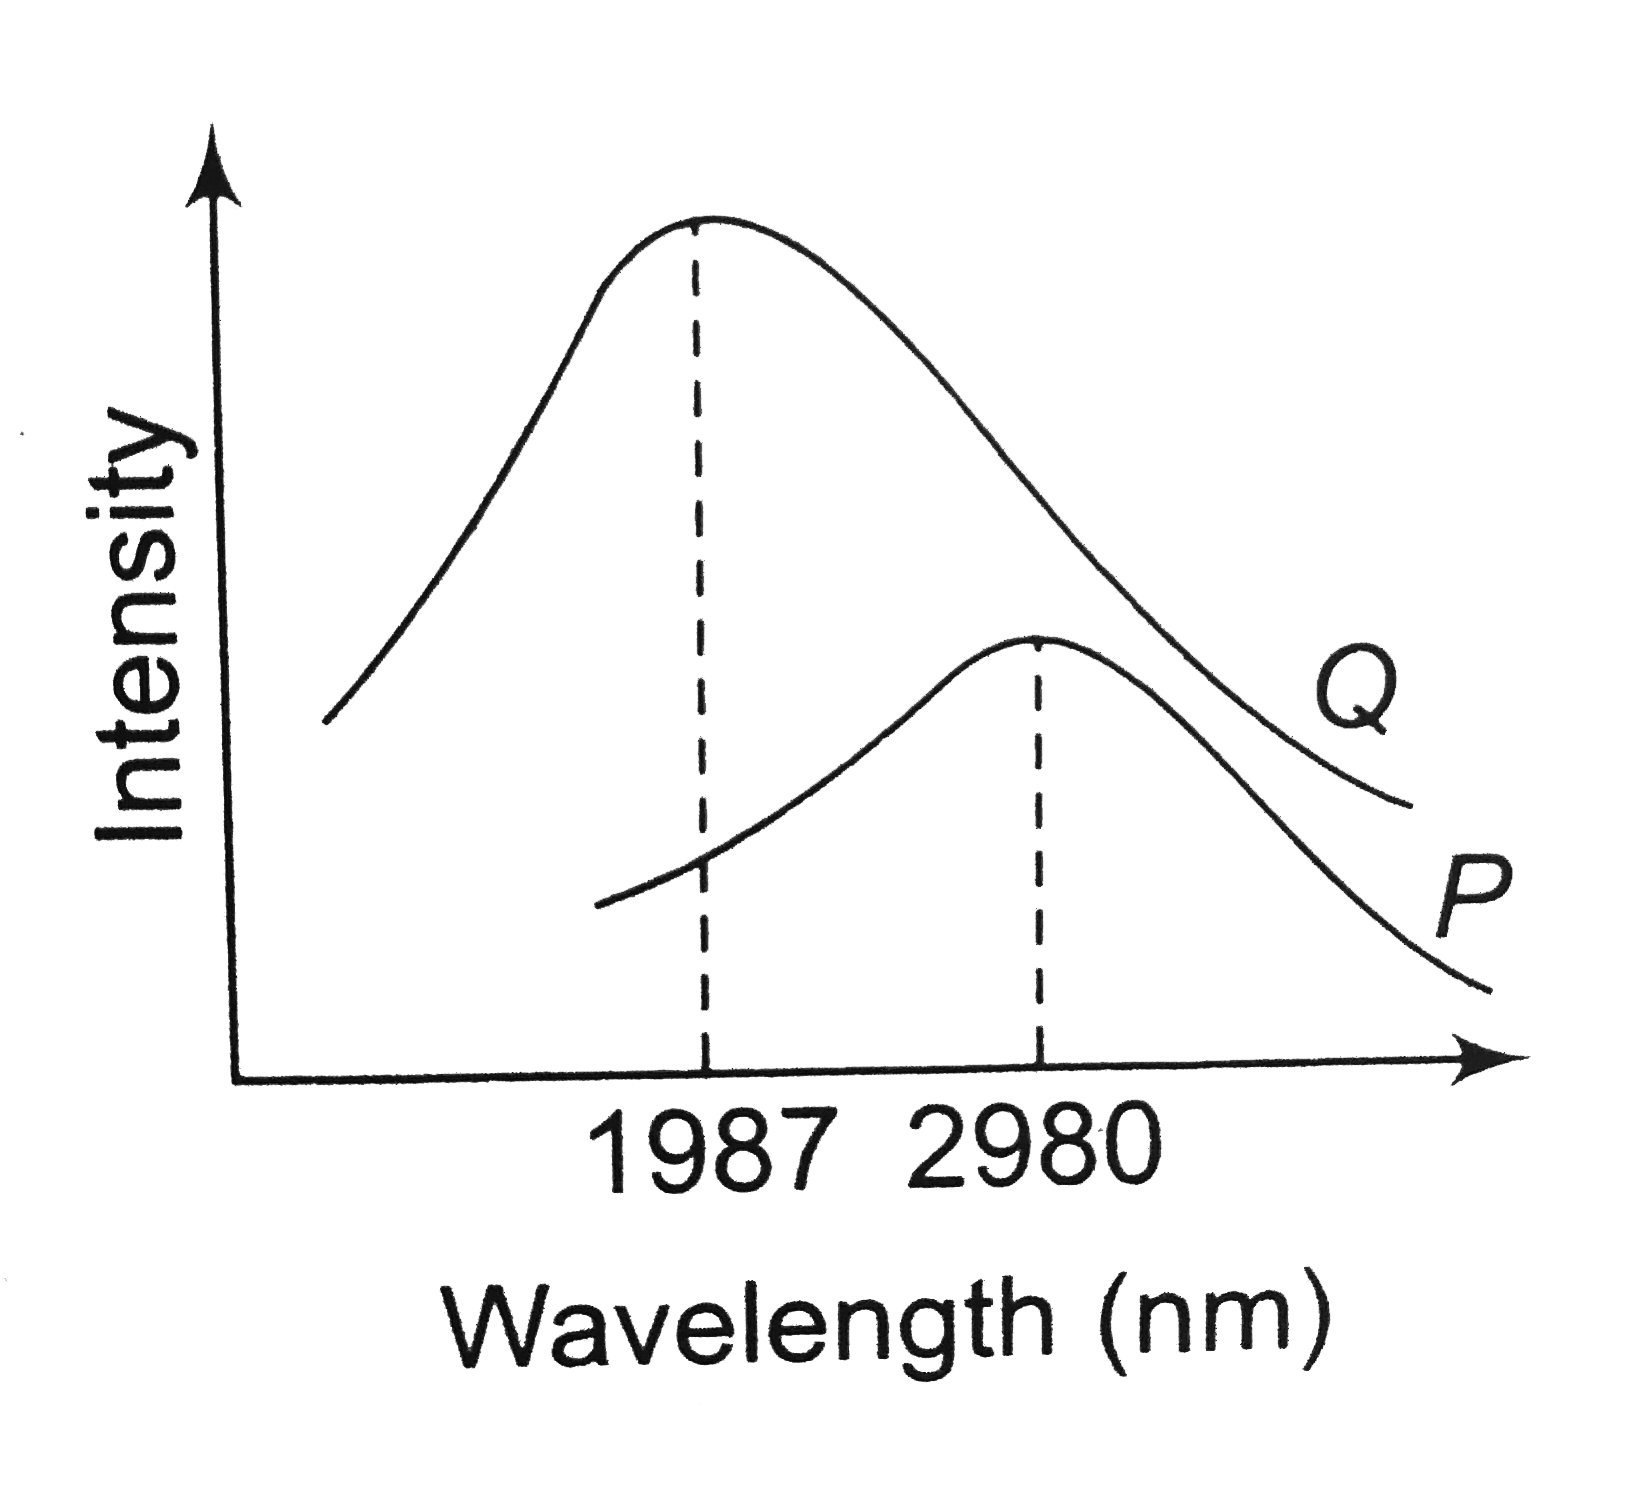
The emission spectrum of a black body at two different temperatures are shown by curves P and Q (as shown in figure). The ratio of the areas under the two curves P and Q will be
 View Solution

