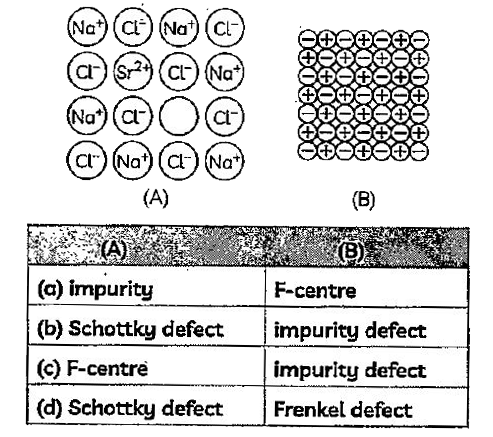
Which defect in solids are illustrated in the figure A and B below?

Text Solution
The figure A is of impurity defect while figure B is of F-centre.
|
Topper's Solved these Questions
- SAMPLE PAPER 8 SOLVED (TERM-1)BOOK - EDUCART PUBLICATIONCHAPTER - SAMPLE PAPER 8 SOLVED (TERM-1)EXERCISE - SECTION -C
6 Videos
- SAMPLE PAPER 8 SOLVED (TERM-1)BOOK - EDUCART PUBLICATIONCHAPTER - SAMPLE PAPER 8 SOLVED (TERM-1)EXERCISE - SECTION -C
6 Videos
- SAMPLE PAPER 3BOOK - EDUCART PUBLICATIONCHAPTER - SAMPLE PAPER 3EXERCISE - SECTION- C
6 Videos
- SAMPLE PAPER 9BOOK - EDUCART PUBLICATIONCHAPTER - SAMPLE PAPER 9EXERCISE - SECTION - C
5 Videos
Similar Questions
Knowledge Check
Which of the following illustrates the influence of surface area of a solid reactant on reaction rate ?
APowered sugar dissolves faster than crystallune sugarBFinely powdered potassium permanganate reacts violently with glycerol than crystalline potassium permanganateCExplosion occurs when an inflammable substance is finely dispersed in a roomDAll of these
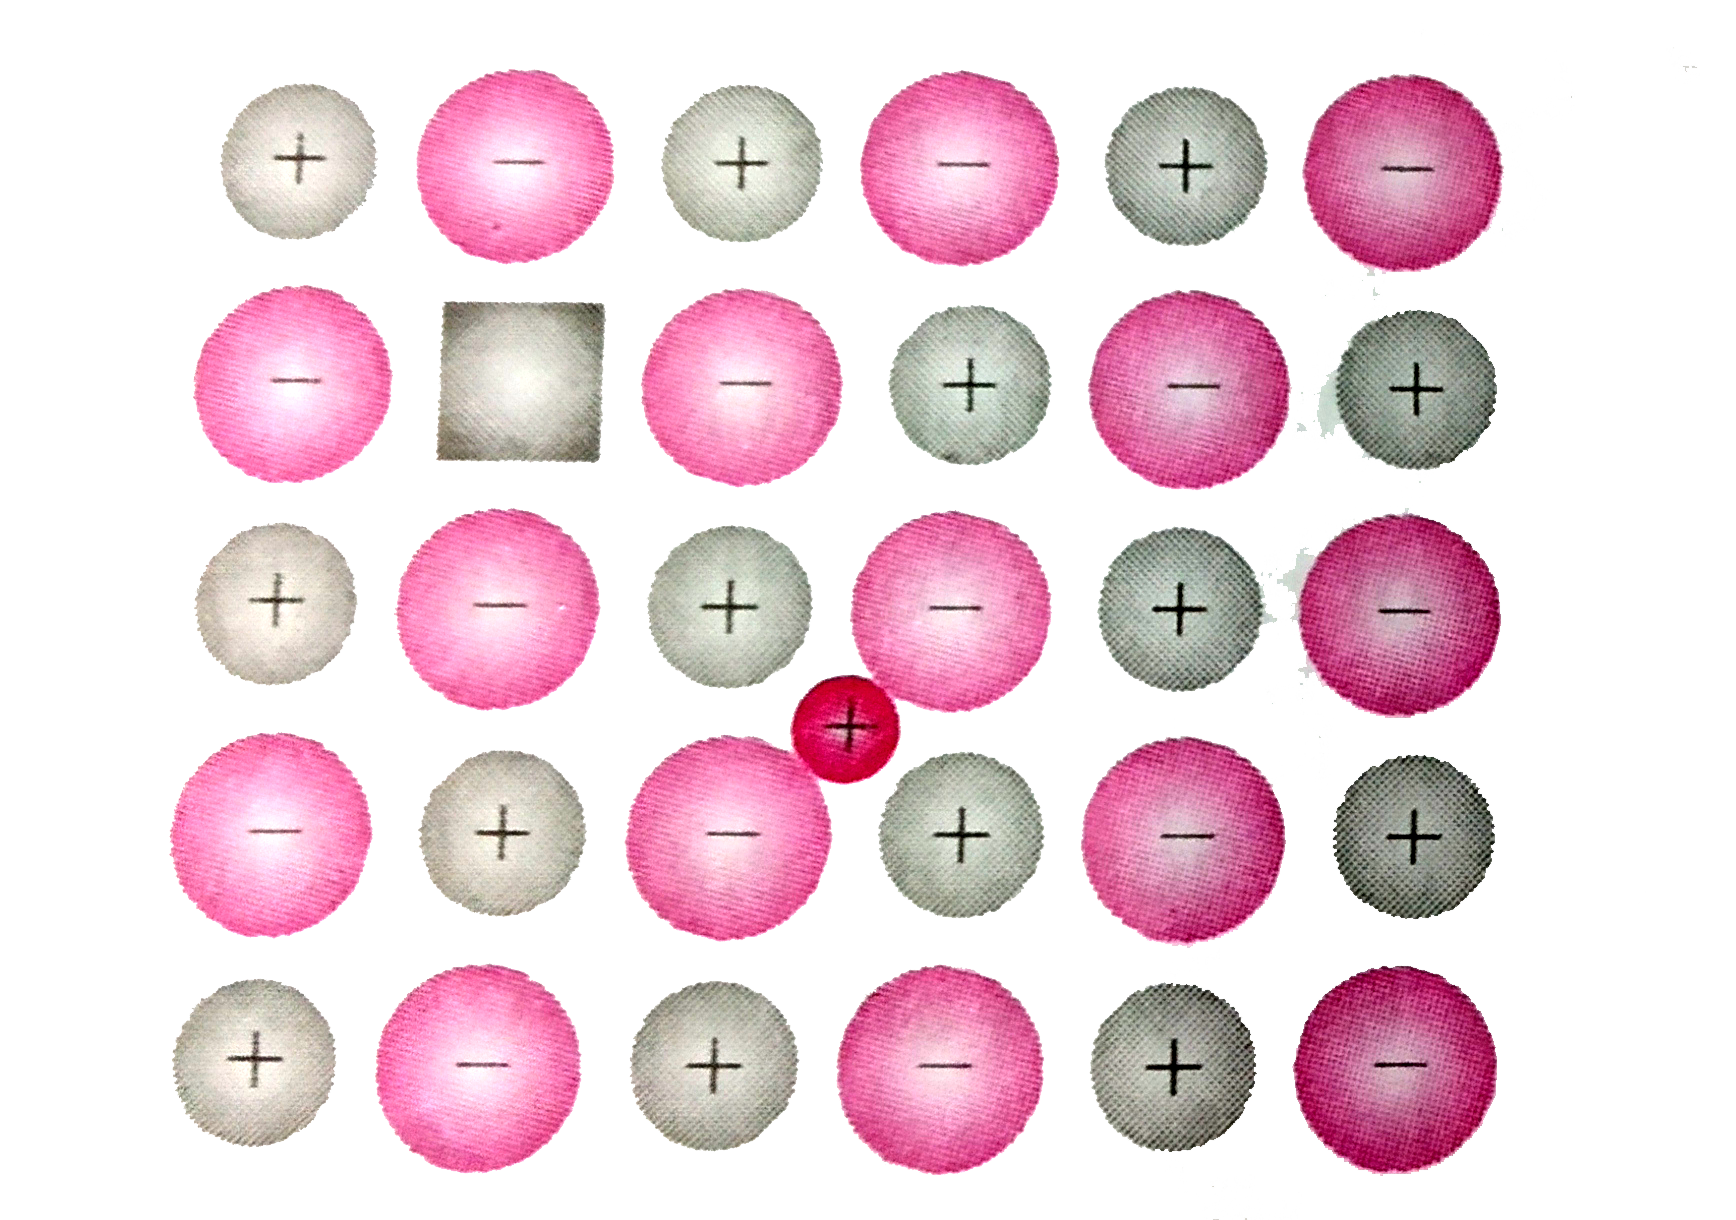
Which is the defect represented by the given figure ?

View SolutionSome crystal defects are shown in the figures below :

Indicate the types of defect shown by (a) and (b).
View SolutionDefects in solids | Magnetic Properties of Solids
View SolutionWhich point defect in crystals of a solid decreases the density of the solid?
View SolutionWhich point defect in crystals of a solid decreases the density of the solid?
View SolutionWhich point defect in crystals of a solid decreases the density of the solid?
View SolutionWhich point defect in crystals of a solid decreases the density of the solid?
View Solution
