The following table gives the plan outlay for 1987-88 for
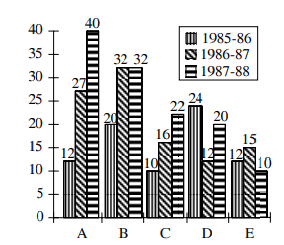
Study the table and mark a tick (sqrt) against the correct answer in each questions given below-
The total plan outlay for A and C is in the ratio-
19:50
101:25
3:2
65:16
The correct Answer is:B
Topper's Solved these Questions
Similar Questions
Study the following table carefully to answer the questions given below.

The total marks obtained by 'A' in all the subjects together is :
View SolutionThe table given below shows the population literate and illiterate in thousand and percentage of literacy in three states in a year -----

After reading the table,mark a tick against the correct answer in each question given below and hence complete the table -----
Literates in Bengal are ------
View Solution
Knowledge Check
The following table gives the plan outlay for 1987-88 for
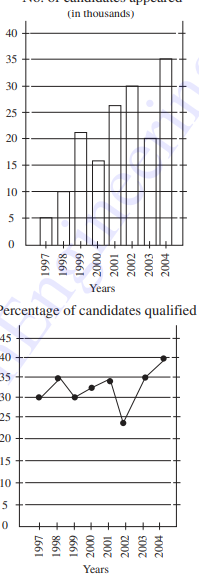
Study the table and mark a tick (sqrt) against the correct answer in each questions given below-
Which area received minimum consideration in State A?AIrrigation and Flood controlBCommunicationCSocial ServicesDRural DevelopmentFollowing table gives the population of a from 1998 to 1992
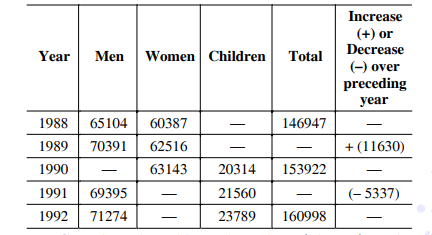
Complete the table and mark a tick against the correct answer in the question ------A31236B125491C14546D21456The table given below shows the population literate and illiterate in thousand and percentage of literacy in three states in a year -----

After reading the table,mark a tick against the correct answer in each question given below and hence complete the table -----
Percentage of Literacy in Chennai is ------A14.9%B13.01%C12.61%D15.64%
Following table gives the populations of a locality from 1988 to 1992. Read the table and answer the questions.

The total population in 1989 is :
View SolutionThe table given below shows the population literate and illiterate in thousand and percentage of literacy in three states in a year -----

After reading the table,mark a tick against the correct answer in each question given below and hence complete the table -----
Percentage of Literacy in Mumbai is------
View SolutionThe following table shows the production of foodgrains in million tonnes in a state for the period from 1988-89 to 1992-93 -----
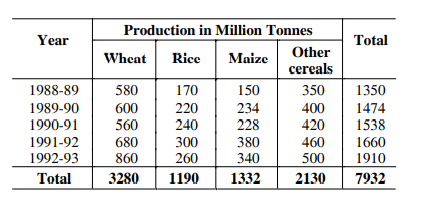
Read the above table and mark a tick against the correct answer in each of the following question -----
During the period from 1988-89 to 1992-93 , what percent of the total production is the wheat ?
View SolutionThe following table shows the production of foodgrains in million tonnes in a state for the period from 1988-89 to 1992-93 -----
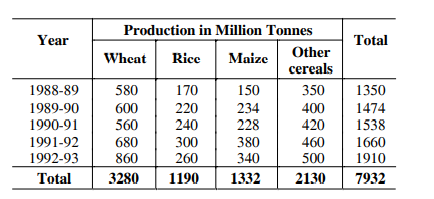
Read the above table and mark a tick against the correct answer in each of the following question -----
During the year 1991-92, the percentage in increase production was maximum for -----
View SolutionThe following table shows the production of foodgrains in million tonnes in a state for the period from 1988-89 to 1992-93 -----
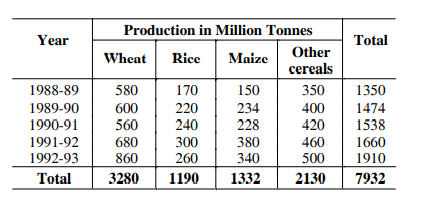
Read the above table and mark a tick against the correct answer in each of the following question -----
During the year 1992-93 the percentage increase in production of wheat over the previous year was ----
View Solution
