Study the following graph carefully and answer given below ------
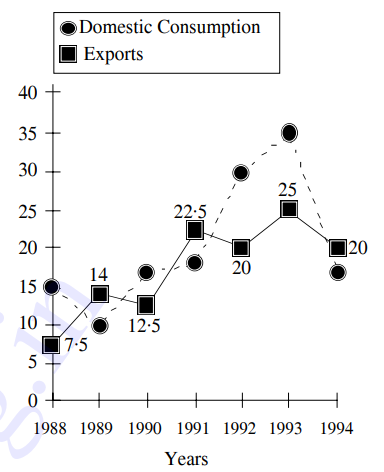
In which of the following years was the total of the exports and domestic consumption highest among the given years ?
1991
1993
1994
1992
The correct Answer is:B
Step by step video, text & image solution for Study the following graph carefully and answer given below ------In which of the following years was the total of the exports and domestic consumption highest among the given years ? by Maths experts to help you in doubts & scoring excellent marks in Class 14 exams.
Topper's Solved these Questions
Similar Questions
Study the following graph carefully and answer the questions given below it -----
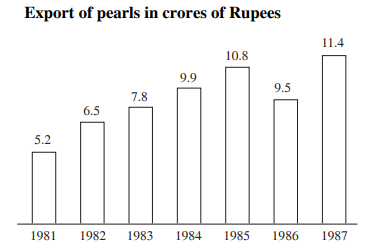
In which of the following pairs of years was the average export of pearls around 9 crores ?View SolutionStudy the following graph carefully and answer the questions given below
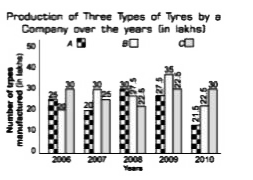
In which of the following years, was the percentage production of B type to C type the maximum?View Solution
Knowledge Check
- Question 1 - Select One
Study the following graph carefully and answer the question given below-----
In which of the following years was the value of sugar per metric ton the lowest among the given years ?A1998B1999C2001D2003 - Question 2 - Select One
Study the following graph carefully and answer the questions given below –
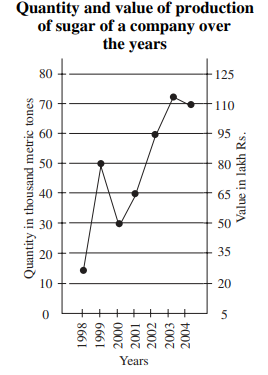
In which of the following years was the value of sugar per metric ton the lowest among the given years?A1998B1999C2001D2003 - Question 3 - Select One
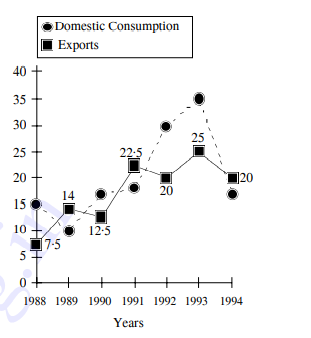
Study the following graph carefully and answer given below ------
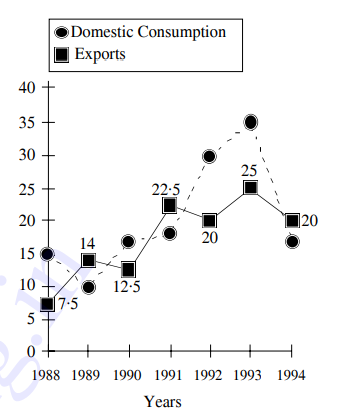
What was the difference between the average domestic consumption and the average exports of the given years ?A2000 tonnesB3000 tonnesC2500 tonnesDNone of these
Study the following graph carefully and answer the questions that follow
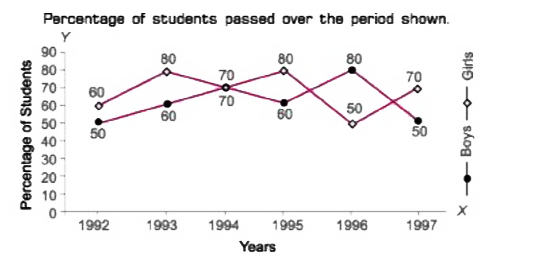
In which of the following years was the improvement of girls maximum as compared to that of previous years ?View SolutionStudy the following graph carefully and answer the questions given below it -----
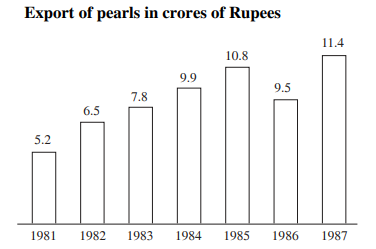
In which year was the export equal to the average export of the preceding and the following year ?View SolutionStudy the following graph carefully and answer the questions given below –
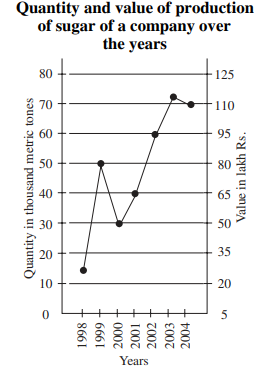
In which of the following years was the percentage increase in value of sugar per metric ton from the previous year the maximum?View SolutionStudy the following table carefully and answer the question given below -----
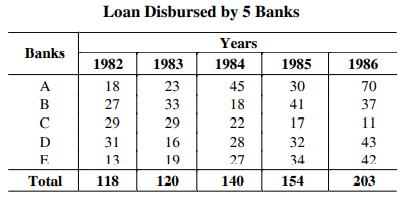
In which of the following banks did the disbursement of loans continuously increase over the years ?View SolutionStudy the following graph carefully and answer the questions given below it -----
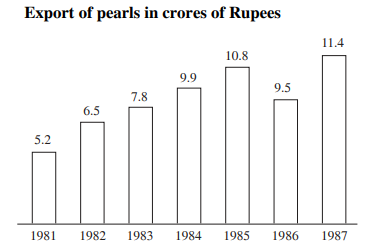
In how many years was the export above the average for the given period ?View Solution

