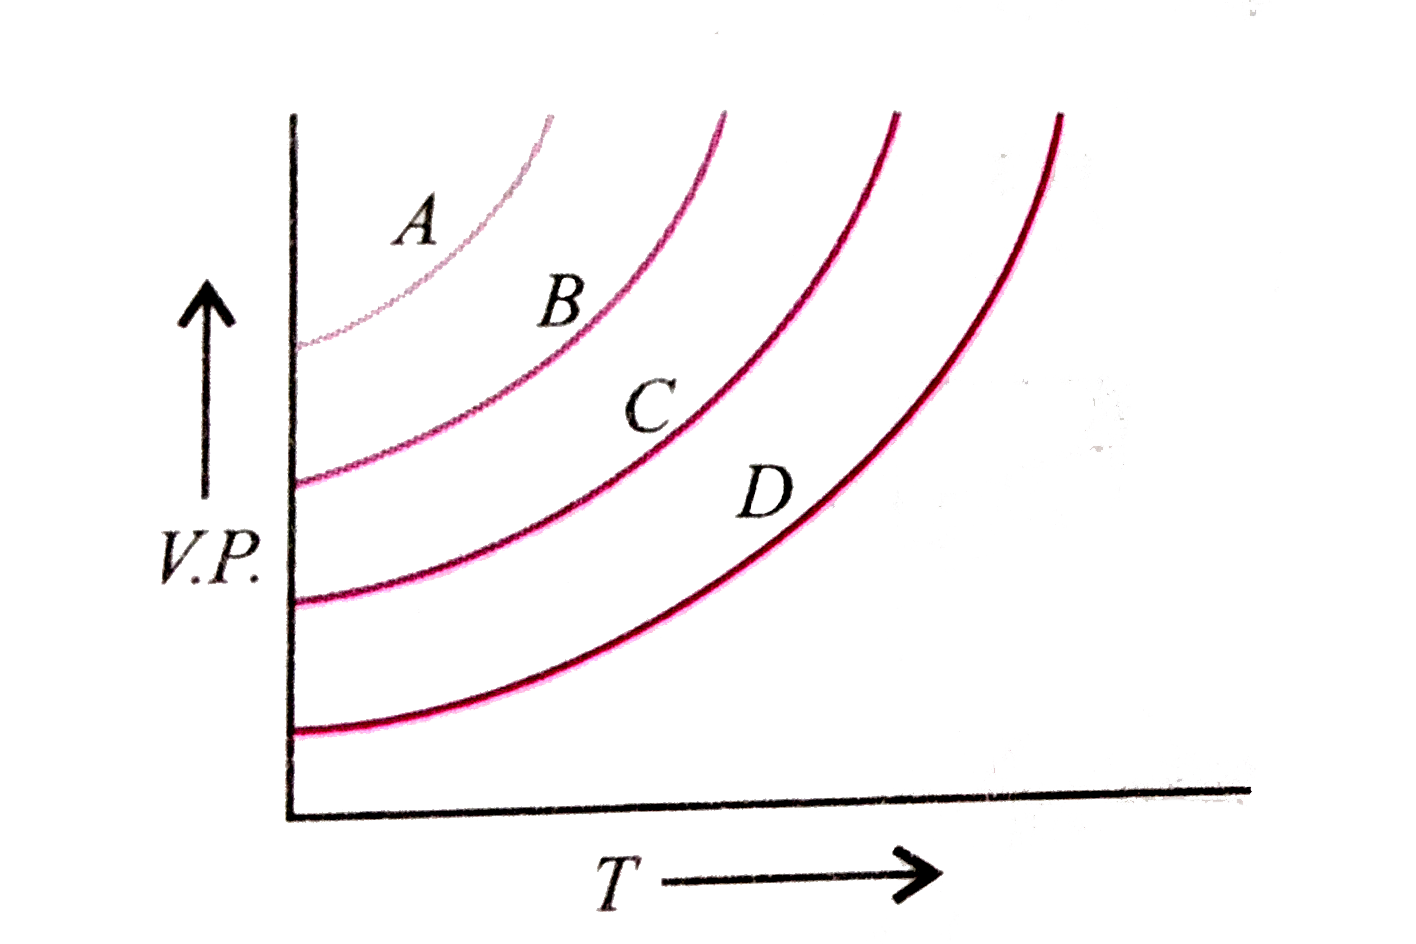
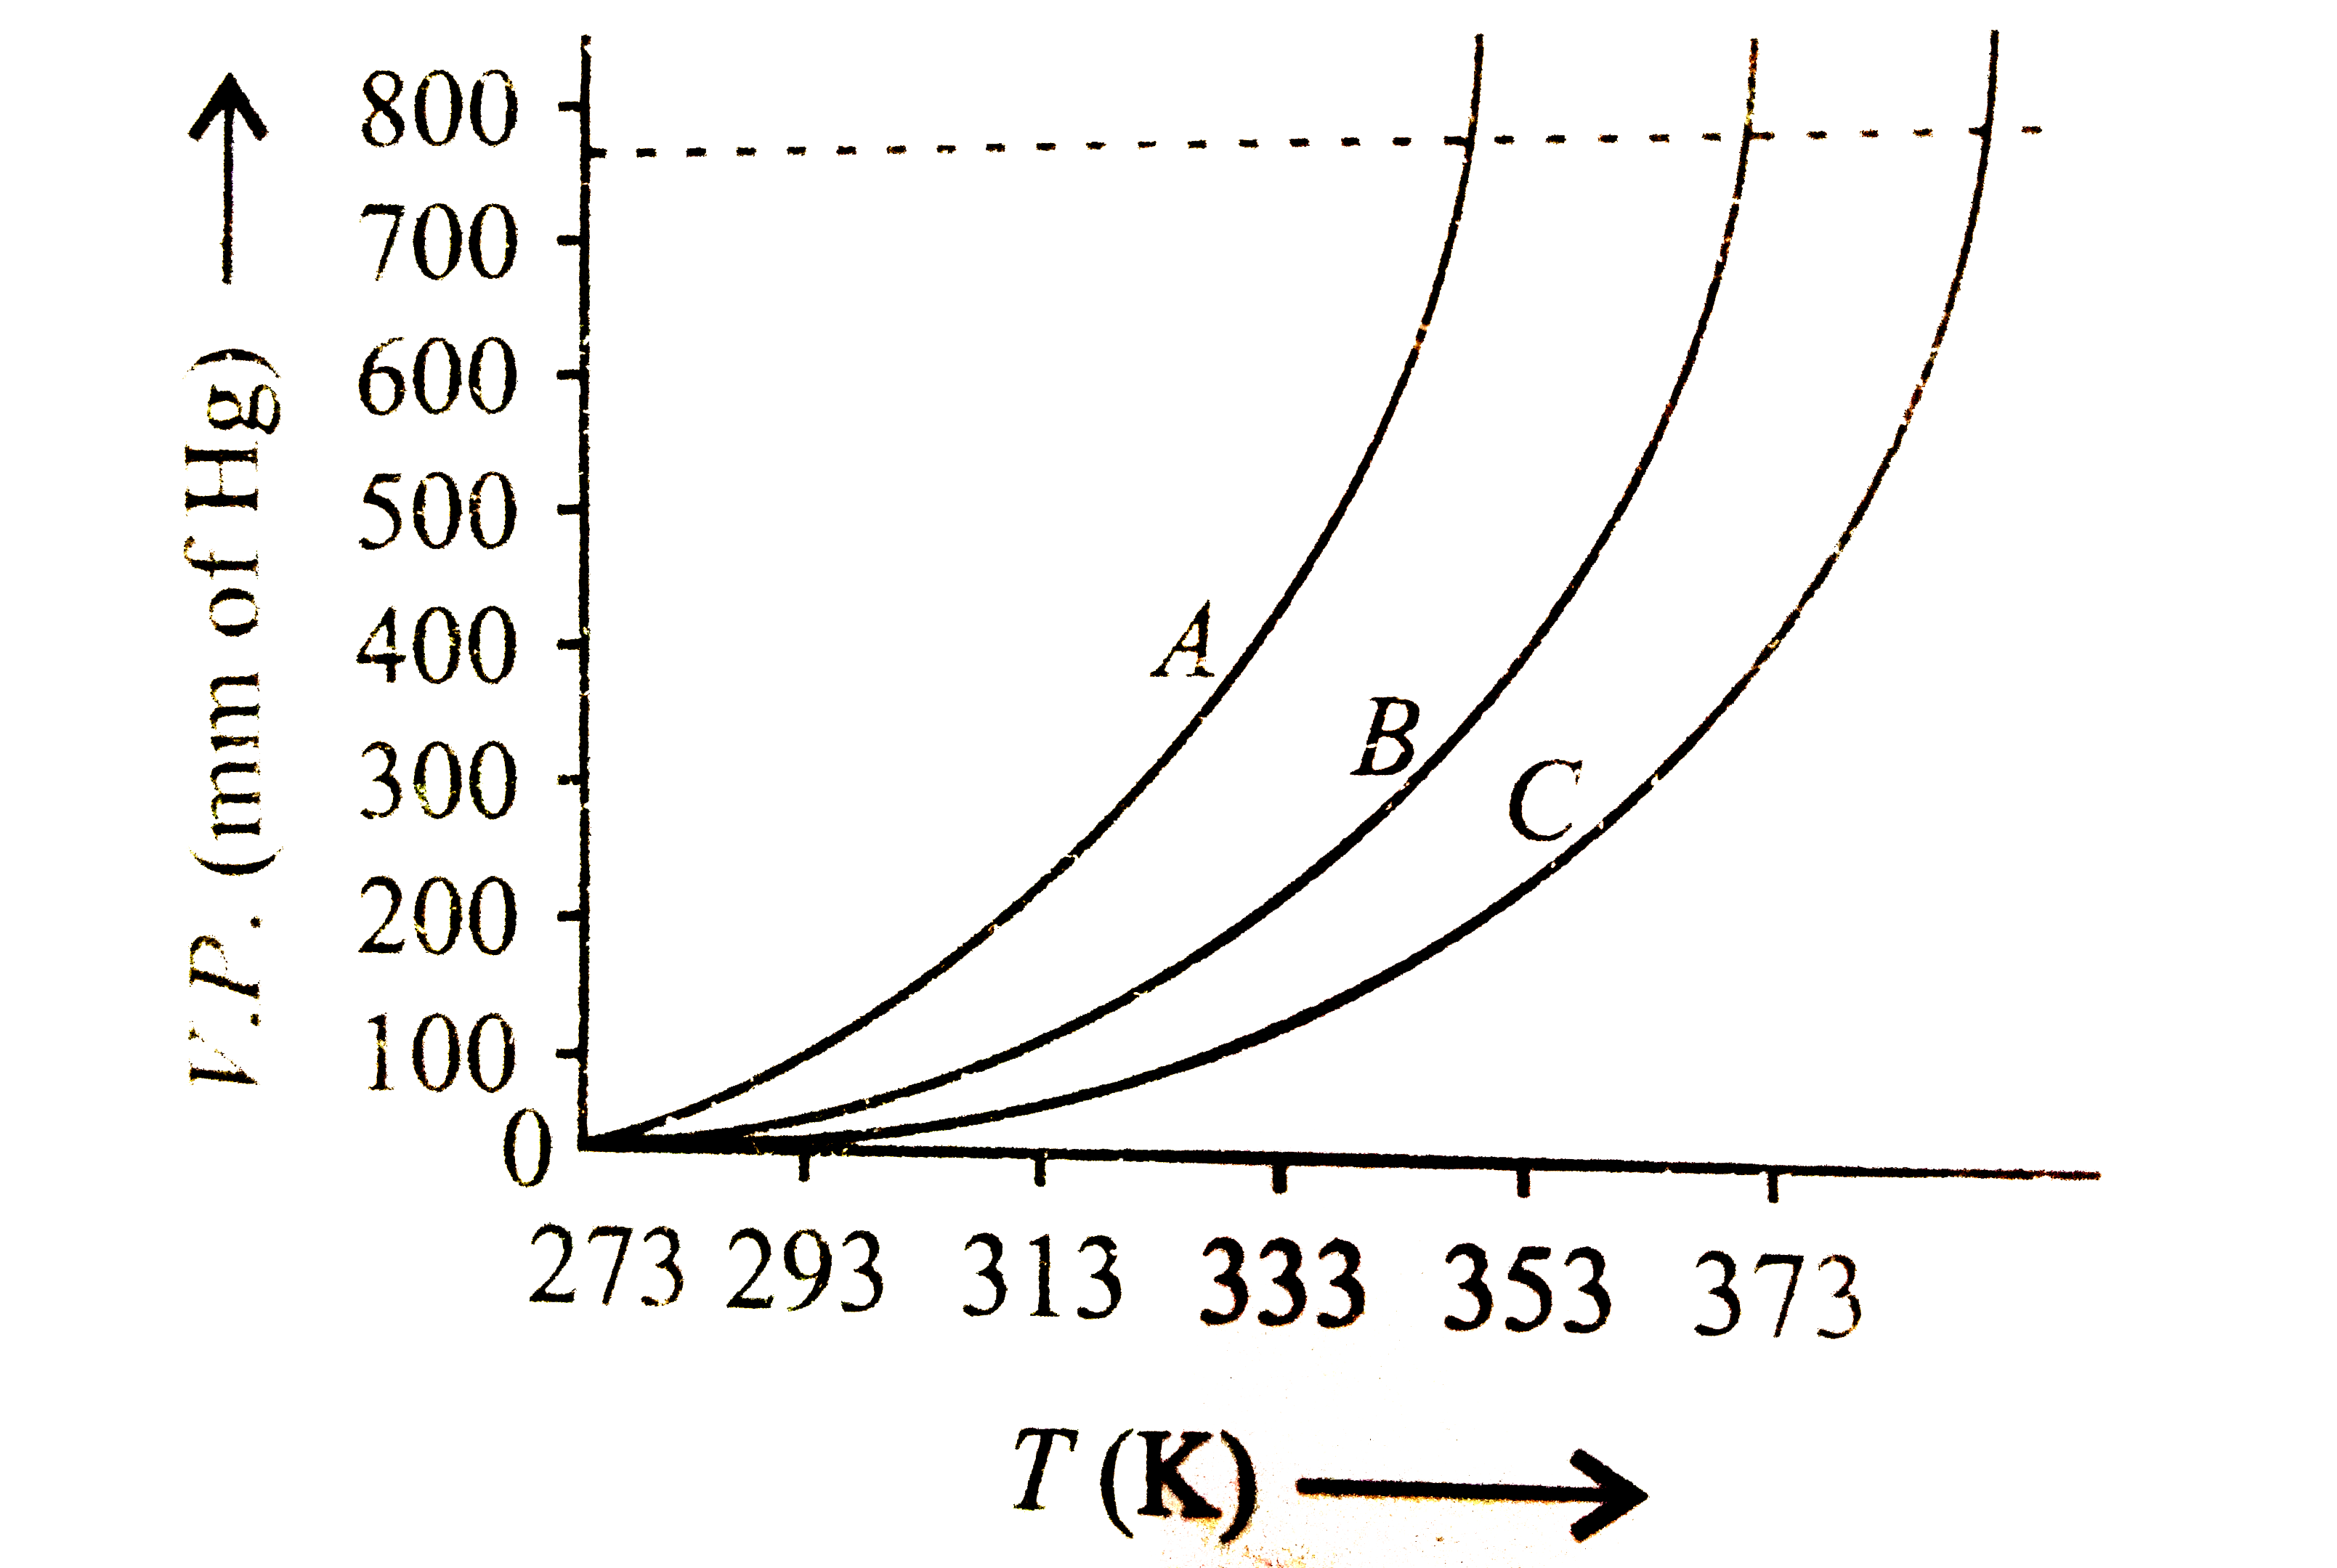
The given graph shows the vapour pressure temperature curves for some liquids.
Liquids A, B, C and Drespectively are,
A
Ethyl alcohol, acetone, diethyl ether, water
B
Water, ethyl alcohol, acetone, diethyl ether
C
Acetone, ethyl alcohol, diethyl ether, water
D
Diethyl ether, acetone, ethyl alcohol, water
Text Solution
The correct Answer is:D
The vapour pressure increases with decrease in intermolecular forces. When the forces are weak, the liquid has high volatility and maximum vapour pressure. Diethyl ether has highest vapour pressure while water has lowest vapour pressure.
|
Topper's Solved these Questions
- SOLUTIONSBOOK - ICSECHAPTER - SOLUTIONSEXERCISE - MULTIPLE CHOICE QUESTIONS (Assertion and Reason based questions)
10 Videos
- SOLUTIONSBOOK - ICSECHAPTER - SOLUTIONSEXERCISE - MULTIPLE CHOICE QUESTIONS (Numerical based questions)
13 Videos
- SOLID STATEBOOK - ICSECHAPTER - SOLID STATEEXERCISE - ISC EXAMINATION QUESTIONS PART-I (Numerical Problems)
6 Videos
- SOME IMPORTANT ORGANIC NAME REACTIONS BOOK - ICSECHAPTER - SOME IMPORTANT ORGANIC NAME REACTIONS EXERCISE - Questions
278 Videos
Similar Questions
Knowledge Check
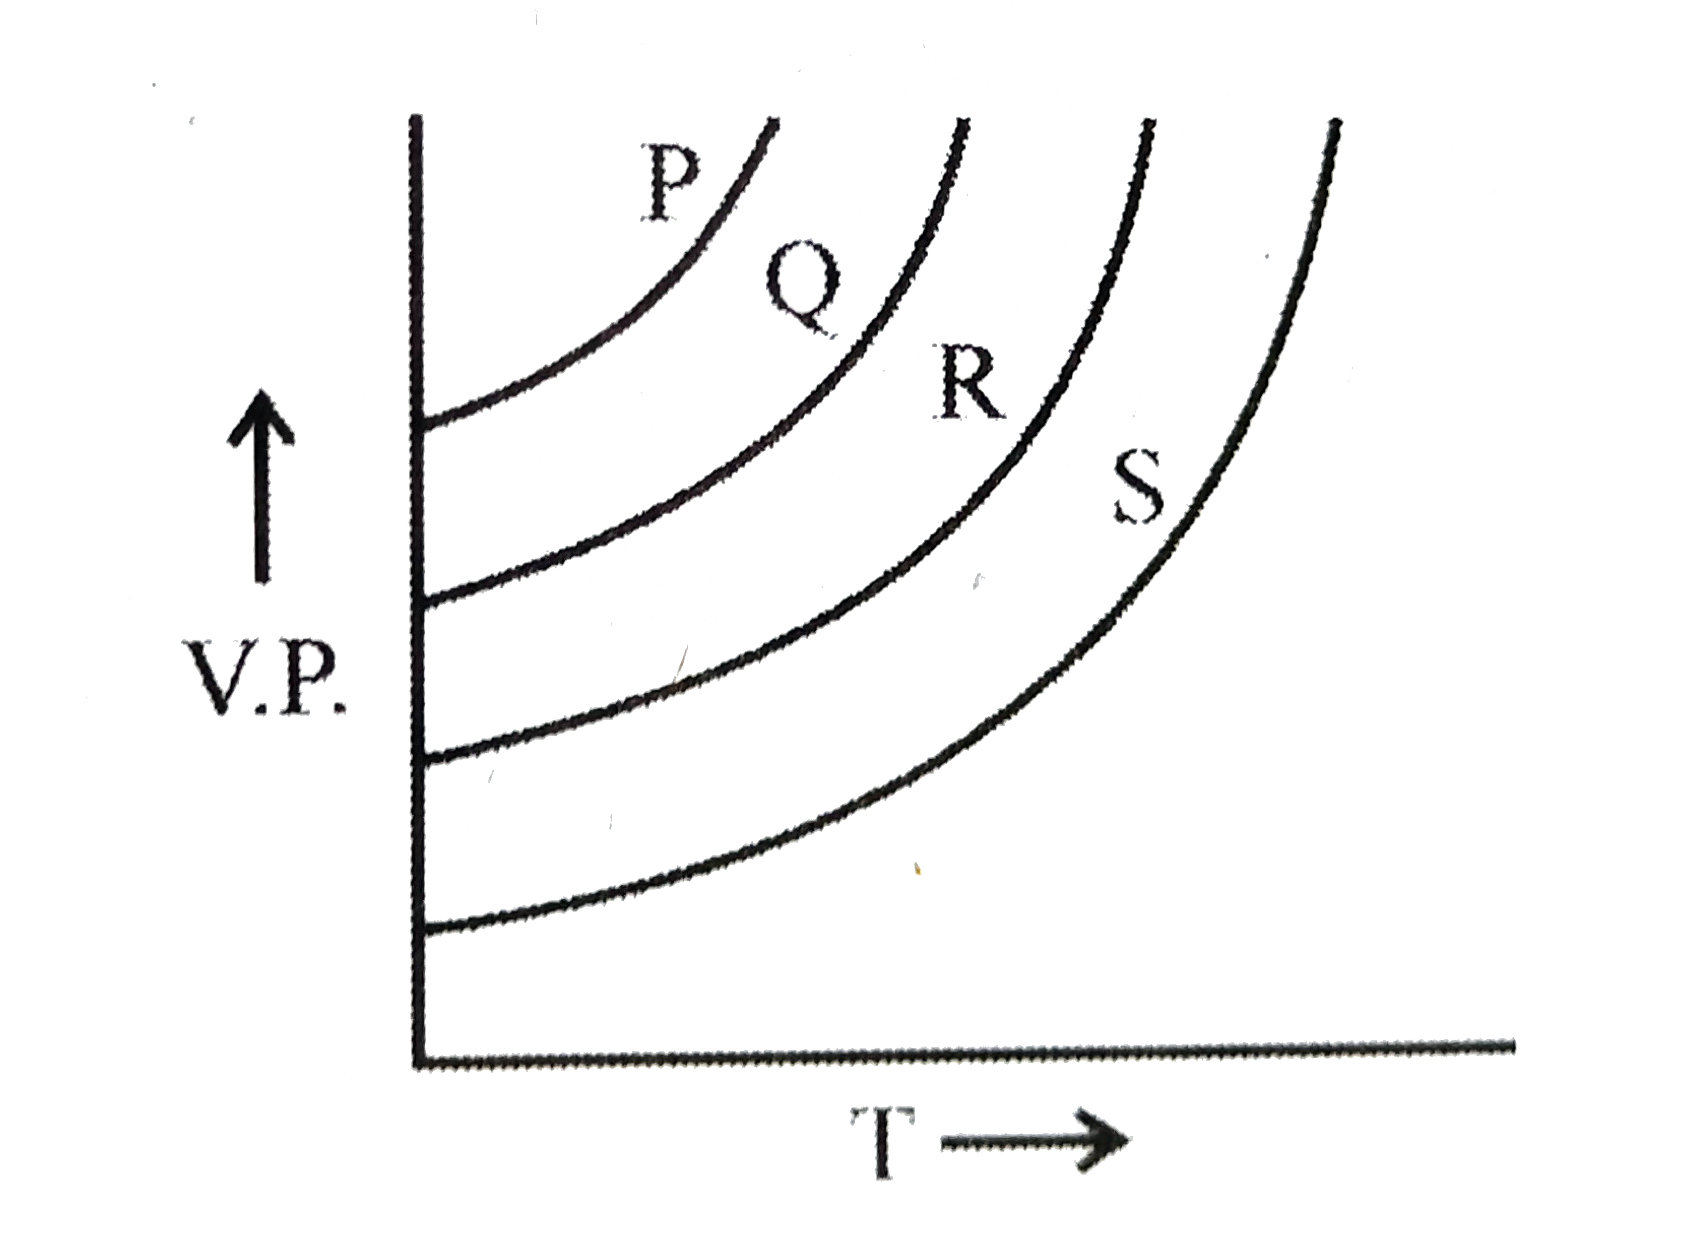
 The given graph shows the vapour pressure- temperature curves for some liquids.
Liquids A,B,C, and D respectively areAdiethyl ether, acetone, ethyl alcohol, whaterBacetone, ehtyl alcohol, diethyl ether, waterCwater, ethyl alcohol, acetone, diethyl etherDethyl alcohol, acetone, diethyl eher, water.The vapour pressure of a given liquid will increase if
ATemperature is increasedBSurface area of liquid is increasedCVolume of liquid in the container is increasedDVolume of the vapour phase is decreasedA graph between vapour pressure and temperature of few liquids is given below. Study the graph and answer following question.
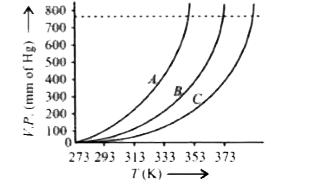
Which of the following statements is not true?ABoiling point of a liquid is the temperature at which its vapour pressure becomes equal to atmospheric pressure.BBoiling point of water can be increased by increased the pressure above the atmospheric pressureCIf liquid B is heated in a closed vessel it will boil at 353 KDLiquid C has higher boilingk point than B due to higher intermolecular forces.
The vapour pressure of pure liquid A and pure liquid B at 20∘C are 22 and 75 mm of Hg respectively. A solution.
View SolutionThe vapour pressure of a given liquid will increase if
View SolutionA graph between vapour pressure and temperature of few liquids is given below . Study the graph and answer the following :
Which of the following statements is true ?
View SolutionThe vapour pressure of a given liquid will decrease if :
View SolutionWhat is the effect of temperature on the vapour pressure of a liquid?
View Solution

