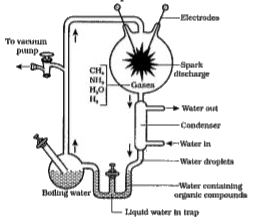
The given diagram represents the :
A
Louis Pasteur's experiment
B
Miller's experiment
C
Oparin's experiment
D
None of these
Text Solution
The correct Answer is:B
The given diagram shows the experiment performed by Stanley Miller in 1953. He took an air tight apparatus and circulated four gases (, and water vapour) through it. He passed electrical discharges from electrodes at . Then he passed the mixture through a condenser. He performed this experiment continuously in this way for a week and analysed the composition of the liquid inside the apparatus. He found a large number of simple organic compounds including some amino acids such as alanine, glycine, and aspartic acid. Miller, thus, proved that organic compounds were basis of life.
|
Updated on:21/07/2023
Similar Questions
Knowledge Check
- Question 1 - Select One
The given diagram represent the Malpighian body. Identify A to D
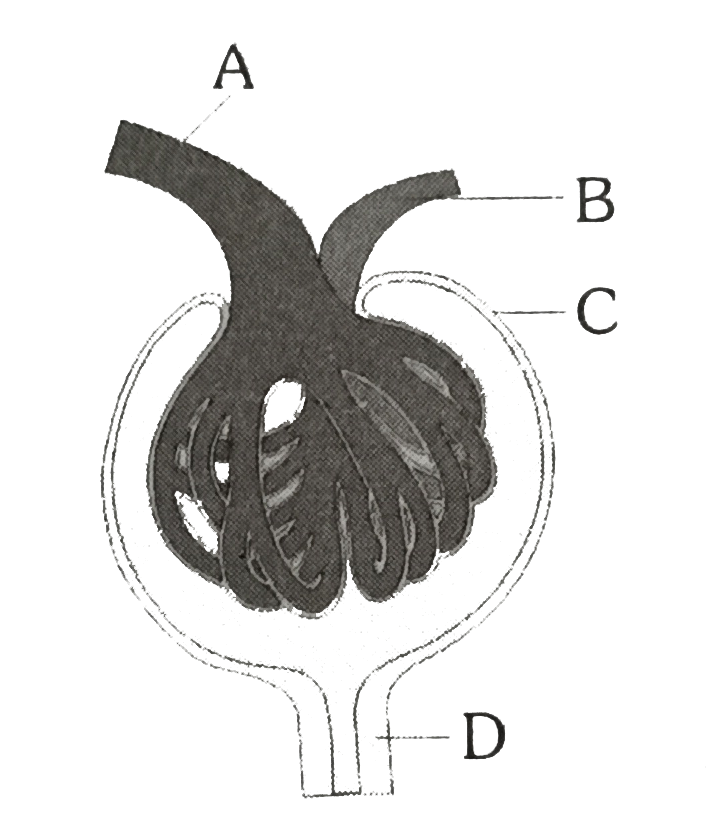 AA-Afferent arteriole, B- Efferent arteriole, C-Bowman's capsule, D-DCTBA-Afferent arteriole, B-Efferent arteriole, C-Bowman's capsule, D-Proximal convoluted tubuleCA-Afferent arteriole, B-Efferent arteriole, C-renal corpuscle, D- Proximal convoluted tubuleDA-Efferent arteriole, B-Afferent arteriole, C- Bowman's capsule, D-Proximal convoluted tubule
 - Question 2 - Select One
What does the given diagram represent ?
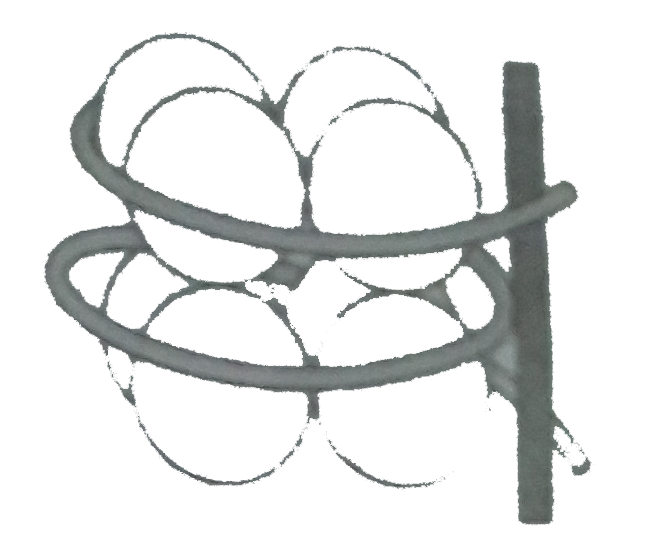 ANucleosomeBSpliceosomeCHistone complexDBoth (a) and (b)
 - Question 3 - Select One
What does the given diagram represent ?
 ANucleosomeBSpliceosomeCHistone complexDBoth (a) and (b)
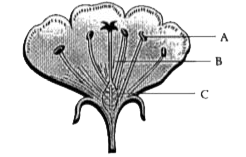
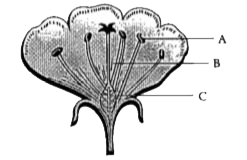
The given diagram represent the structure of a flower. Study the structure
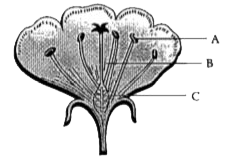
Which of these is the function of part labelled as C?View SolutionThe given diagram represents two sets A and B on real number lines.

Write down A and B in set-builder notation.View SolutionThe given diagram represents which type of plant ?
(The red line indicates the critical period).
 View Solution
The given diagram represents which type of plant ?
(The red line indicates the critical period).
 View Solution
The given diagram represents a ________reaction.
 View Solution


