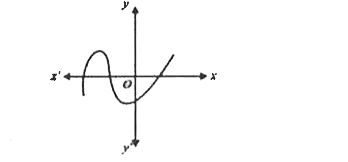
दिए गए ग्राफ y= p(x) से बहुपद p(x) के शून्यकों की संख्या लिखिए।

The correct Answer is:3
Step by step video, text & image solution for दिए गए ग्राफ y= p(x) से बहुपद p(x) के शून्यकों की संख्या लिखिए। by Maths experts to help you in doubts & scoring excellent marks in Class 10 exams.
Updated on:21/07/2023Topper's Solved these Questions
- ANNUAL EXAMINATION 2015BOOK - JHARKHAND BOARD PREVIOUS YEAR PAPERSCHAPTER - ANNUAL EXAMINATION 2015EXERCISE - MATHEMATICS खण्ड-B
6 Videos
- ANNUAL EXAMINATION 2015BOOK - JHARKHAND BOARD PREVIOUS YEAR PAPERSCHAPTER - ANNUAL EXAMINATION 2015EXERCISE - MATHEMATICS खण्ड-C
13 Videos
- ANNUAL EXAMINATION 2014BOOK - JHARKHAND BOARD PREVIOUS YEAR PAPERSCHAPTER - ANNUAL EXAMINATION 2014EXERCISE - गणित खंड -D
7 Videos
- ANNUAL EXAMINATION 2016BOOK - JHARKHAND BOARD PREVIOUS YEAR PAPERSCHAPTER - ANNUAL EXAMINATION 2016EXERCISE - MATHEMATICS खण्ड-D
7 Videos
Similar Questions
एक द्विघात बहुपद लिखिए जिसके शून्यकों का योग -3 और गुणनफल 2 है।
View Solutionयक्लिह विभाजन एल्गोरिथ्म का प्रयोग करके 420 और 272 का HCF ज्ञात कीजिए।
View Solutionद्विघात समीकरण 3x2−2x+13=0 का
a. विविक्तकर
b. मूलों की प्रकृति तथा
c. द्विघाती सूत्र का उपयोग कर मूल ज्ञात कीजिए।
View Solutionनिम्न द्विघात समीकरण के मूलो का अस्तित्व हो , तो द्विघात सूत्र का प्रयोग द्वारा उनके मूल ज्ञात करे :
4x2+4√3x+3=0
View SolutionHow many lines of symmetry does the above figure have ?
View SolutionWhich of the following are correct chain isomers of butane ? (i)
View SolutionDetermine the point of symmetry of a regular hexagon.
View SolutionDtermine the images of the following figure about the given line :
View SolutionMatch the following Column A to Column B

View SolutionMatch the following Column A to Column B

View SolutionMatch the following Column A to Column B

View SolutionThe inequation represented by the graph given below is :
View SolutionThe inequation that best describes the graph given below is _________
View SolutionThe inequation that best describes the following graph is _________
View SolutionWhich inequations represent the shaded region in the given figure
View SolutionIn Fig, find the value of x.
ltimg src="https://d10lpgp6xz60nq.cloudfront.net/physics_images/PS_MATH_IX_C12_S01_032_Q01.png" width="80%"gt
View Solution
