The following pie chart shows friuit tree distribution in a farm land. Consider the chart and answer questions based on it.
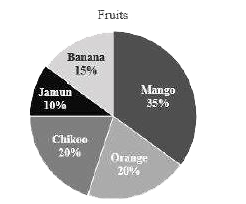
What is the ration of Chikoo and Mango trees to that Jamu, Orange and Banana trees in the farm land?
A. 1
B.
C.
D.
1
Step by step video solution for The following pie chart shows friuit tree distribution in a farm land. Consider the chart and answer questions based on it. What is the ration of Chikoo and Mango trees to that Jamu, Orange and Banana trees in the farm land? A. 1 B. 1:3 C. 11:9 D. 3:1 by Maths experts to help you in doubts & scoring excellent marks in Class 12 exams.
Updated on:21/07/2023Similar Questions
The following pie chart shows friuit tree distribution in a farm land. Consider the chart and answer questions based on it.
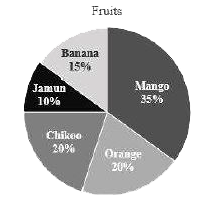
If there are in all 960 trees, then how many of them are Mango trees?
A. 192
B. 288
C. 384
D. 336
View SolutionThe following pie chart shows fruit tree distribution in a farm land. Consider the chart and answer questions based on it .
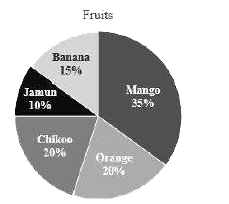
The sector angle corresponding to the Banana is
A. 90∘
B. 54∘
C. 72∘
D. 36∘
View Solution
Knowledge Check
The given pie chart shows the percentage distribution of 450 employees in an organisation. Study the pie chart and answer the question that follows.
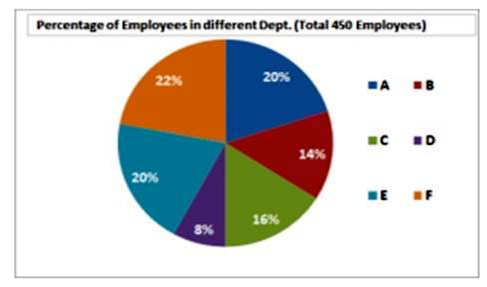
What is the number of employees working in departmetn B?A90B72C36D63The following pie-chart shows the percentage distribution of the expenditure incurred in publishing a book. Study the pie-chart and answer the questions based on it.
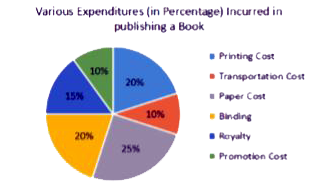
What is the central angle of the sector corresponding to the expenditure incurred on binding?A72∘B90∘C48∘D70∘Comprehension:
The bar chart represents marks of four students S1, S2, S3 and S4 in Physics and Chemistry. Consider the bar chart and answer questions based on it.
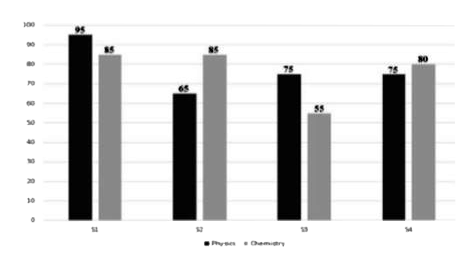
What is the ratio of marks obtained in Physics of S3 to that of S 1?A11/19B15/19C13/19D17/19
The following charts shows the sales (in thousands) of pens , pencils and books in month1 , month2 and month3 . Answer the question based on the chart .
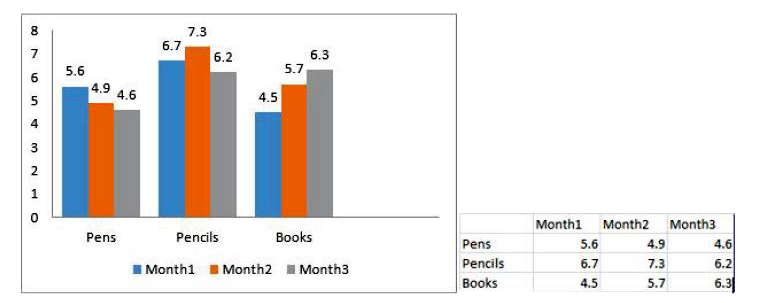
What is the average number of pens sold in the 3 months ?
View SolutionThe following pie chart shows the hourly distribution of all the major activities of a student.
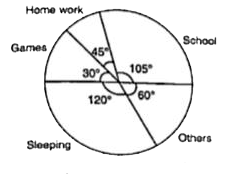
If he spends 13 rd time of home work in Mathematics then the no. of hours spends in rest of the subjects in home work :
View SolutionComprehension:
The bar chart represents marks of four students S1, S2, S3 and S4 in Physics and Chemistry. Consider the bar chart and answer questions based on it.
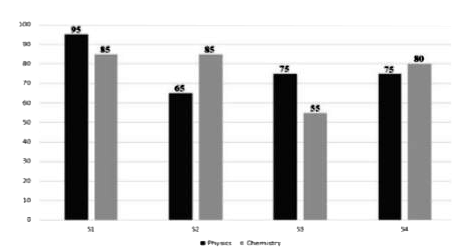
What is the ratio of total marks in both subjects obtained by S2 to that of S4?
View SolutionThe following chart shows the sales (in thousands) of pencils and books in month1, month2, and month3, Answer the question based on the chart .
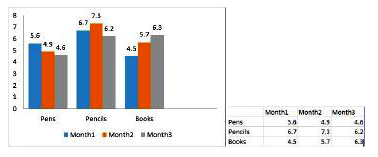
Which product has the highest sales in all 3 months ?
View SolutionThe following pie-chart shows the percentage distribution of the expenditure incurred in publishing a book. Study the pie-chart and answer the questions based on it.
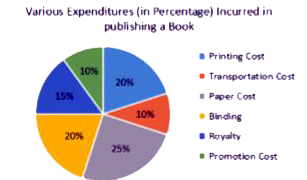
If for a certain quantity of books, the publisher has to pay ₹30,600 as printing cost, then what will be amount of paper cost to be paid for these books?
View Solution
