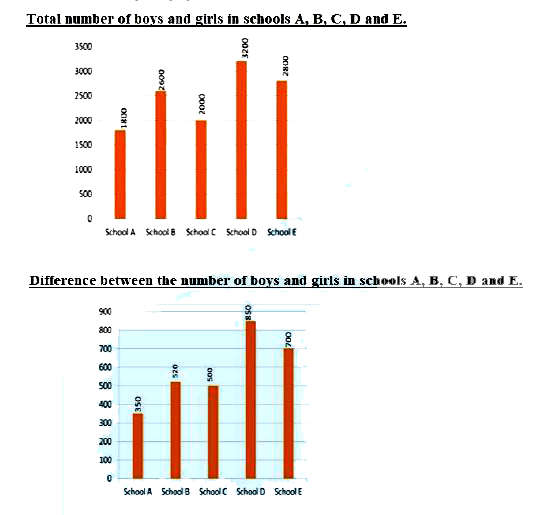
Study the following bar graph carefully and answer the questions given below-
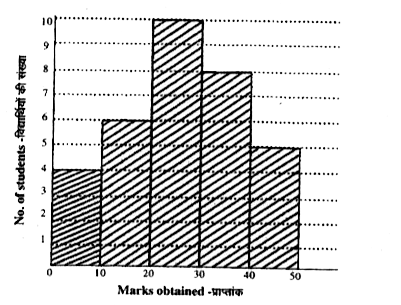
Ratio of the number of students, who obtained marks in first and last interval
Step by step video solution for Study the following bar graph carefully and answer the questions given below- Ratio of the number of students, who obtained marks in first and last interval by Maths experts to help you in doubts & scoring excellent marks in Class 12 exams.
Updated on:21/07/2023Similar Questions
Knowledge Check
Study the following bar graph and answer the question that follows.
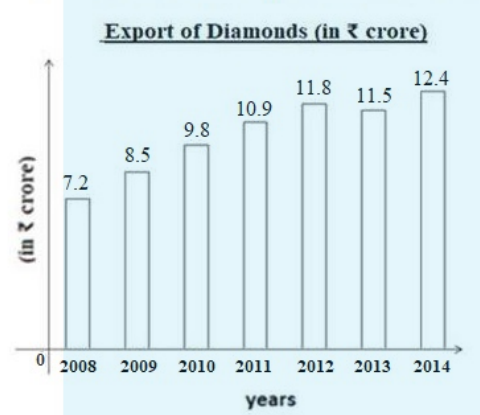
In which year was the maximin percentage increase in diamonds exports compared to the previous year?A2014B2009C2010D2012Study the following graph carefully and answer the questions given below. The number of students who joined and left the school in the beginning of year for six years from 2003 to 2008. (Initial Strength of the school is 2000)
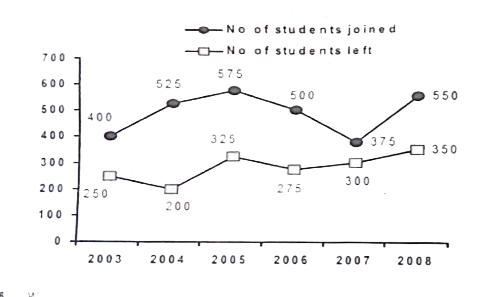
The number of students in 2006 is approximately what percent of the number of student in 2004 ?A0.91B1C1.08D1.15Study the following graph carefully and answer the questions given below. The number of students who joined and left the school in the beginning of year for six years
from 2003 to 2008
Initial Strength of the school is 2000
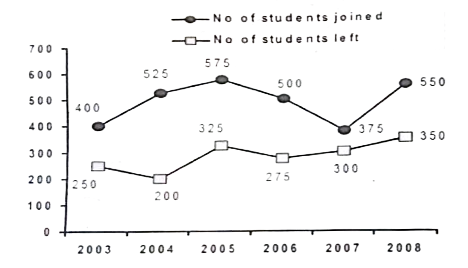
For which of the following year, the percentage rise/fall in the number of students left from the previous year is the hightest?A2003B2004C2006D2005
Study the following graph carefully and answer the questions given below :
Number of students studying in different University in a year (Number in lakhs)
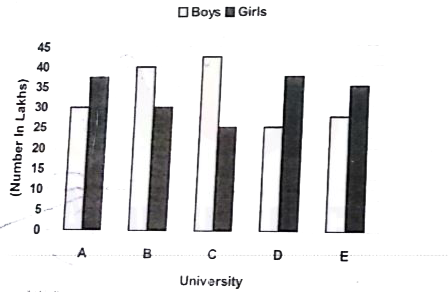
What is the total number of students (Boys & Girls) in university A and C together ?
View SolutionRead the following graph and answer the questions given below
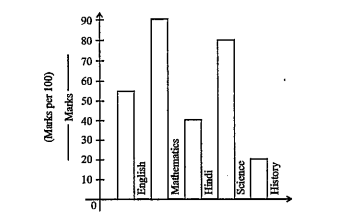
average marks obtained by the student is
View SolutionStudy the following graph carefully and answer the questions given below :
Number of students studying in different University in a year (Number in lakhs)
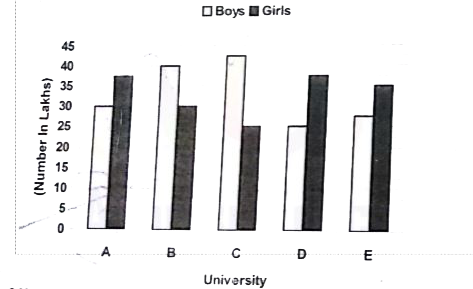
What is the average number of boys in all university together ?
View SolutionStudy the following graph carefully and answer the questions given below it -----
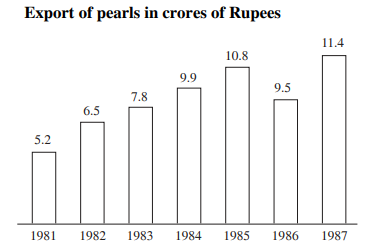
What was the percentage increase in export from 1986 to 1987 ?
View SolutionStudy the following graph carefully and answer the question given below-----
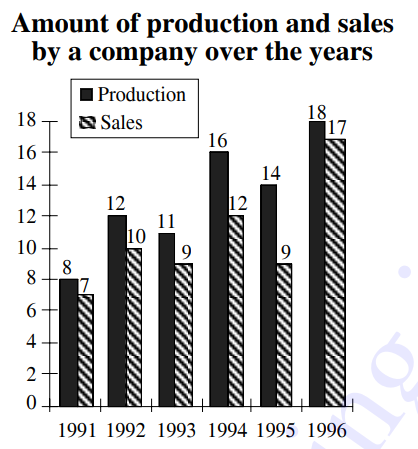
What was the difference between the sales of 1992 and 1995 ?
View Solution

