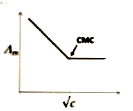
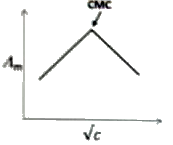
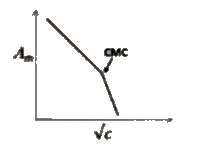
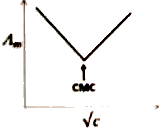
Molar conductivity (Λm) of aqueous solution of sodium stearate, which behaves as a strong electrolyte, is recorded at varying concentrations (c ) of sodium stearate. Which one of the following plots provides the correct representation of micelle formation in the solution? (critical micelle concentration (CMC) is marked with an arrow in the figures)


To solve the question regarding the molar conductivity (Λm) of sodium stearate and its representation in plots concerning micelle formation, we can follow these steps:
1. Understanding Molar Conductivity (Λm):
- Molar conductivity (Λm) is a measure of how well an electrolyte conducts electricity in solution. For strong electrolytes like sodium stearate, Λm is expected to change with concentration.
2. Behavior of Strong Electrolytes:
- At low concentrations, strong electrolytes dissociate completely into ions, leading to an increase in conductivity. However, as concentration increases, the molar conductivity typically decreases due to ion pairing and reduced mobility of ions.
3. Critical Micelle Concentration (CMC):
- The critical micelle concentration (CMC) is the concentration at which surfactant molecules (like sodium stearate) start to form micelles. Below this concentration, the conductivity decreases as the concentration increases. Above this concentration, the formation of micelles leads to a significant change in conductivity.
4. Plot Analysis:
- Before reaching CMC, as the concentration increases, Λm decreases. Upon reaching CMC, there is an abrupt change in the trend of Λm due to micelle formation, which reduces the number of free ions in the solution.
- After CMC, the molar conductivity will continue to decrease, but at a different rate, often more sharply, due to the formation of micelles.
5. Choosing the Correct Plot:
- We need to identify which plot correctly represents this behavior:
- Option 1: Incorrect, as it shows a constant Λm after a decrease.
- Option 2: Incorrect, as it shows an increase after a decrease.
- Option 3: Correct, as it shows a decrease up to CMC and a more abrupt decrease after CMC.
- Option 4: Incorrect, as it shows an increase after CMC.
Conclusion:
The correct plot that represents the behavior of molar conductivity (Λm) of sodium stearate in relation to micelle formation is Option 3.
- Molar conductivity (Λm) is a measure of how well an electrolyte conducts electricity in solution. For strong electrolytes like sodium stearate, Λm is expected to change with concentration.
- At low concentrations, strong electrolytes dissociate completely into ions, leading to an increase in conductivity. However, as concentration increases, the molar conductivity typically decreases due to ion pairing and reduced mobility of ions.
- The critical micelle concentration (CMC) is the concentration at which surfactant molecules (like sodium stearate) start to form micelles. Below this concentration, the conductivity decreases as the concentration increases. Above this concentration, the formation of micelles leads to a significant change in conductivity.
- Before reaching CMC, as the concentration increases, Λm decreases. Upon reaching CMC, there is an abrupt change in the trend of Λm due to micelle formation, which reduces the number of free ions in the solution.
- After CMC, the molar conductivity will continue to decrease, but at a different rate, often more sharply, due to the formation of micelles.
- We need to identify which plot correctly represents this behavior:
- Option 1: Incorrect, as it shows a constant Λm after a decrease.
- Option 2: Incorrect, as it shows an increase after a decrease.
- Option 3: Correct, as it shows a decrease up to CMC and a more abrupt decrease after CMC.
- Option 4: Incorrect, as it shows an increase after CMC.
The correct plot that represents the behavior of molar conductivity (Λm) of sodium stearate in relation to micelle formation is Option 3.
Topper's Solved these Questions
Similar Questions
Molar conductivity (A) of aqueous solution of sodium stearate, which behaves as a strong electrolyte, is recorded at varying concentrations (C) of sodium stearate. Which one of the following plots provides the correct representation of micelle formation in the solution? (Critical micelle concentration (CMC) is marked with an arrow in the figures)
View SolutionWhich one of the following forms micelles in aqueous solution above certain concentration?
View Solution
Knowledge Check
Molar conductivity (L) m of aqueous solution of sodium stearate, which behaves as a strong electrolyte, is recorded at varying concentrations (c) of sodium stearate. Which one of the following plots provides the correct representation of micelle formation in the solution?
(Critical micelle concentration (CMC) is marked with an arrow in the figures)A B
B C
C D
D
Molar conductivity (A) of aqueous solution of sodium stearate, which behaves as a strong electrolyte, is recorded at varying concentrations (C) of sodium stearate. Which one of the following plots provides the correct representation of micelle formation in the solution? (Critical micelle concentration (CMC) is marked with an arrow in the figures)
A B
B C
C D
D
Molar conductivity (A) of aqueous solution of sodium stearate, which behaves as a strong electrolyte, is recorded at varying concentrations (C) of sodium stearate. Which one of the following plots provides the correct representation of micelle formation in the solution? (Critical micelle concentration (CMC) is marked with an arrow in the figures)
A B
B C
C D
D
Which one of the following forms micells in aqueous solution above certain concentration?
View SolutionWhich one of the following forms micelles in aqueous solution above certain concentration?
View SolutionSodium stearete is a strong electrolyte. Which of the following plot is correct regarding its conductance
View SolutionWhich one of the following forms micelles in aqueous solution above certain concentration?
View SolutionWhich one of the following forms micelles in aqueous solution above certain concentration?
View Solution
