In which year the firm has shown maximum percentage increase in its revenue with respect to the previous year?
2011
2014
2016
All are equal
The correct Answer is:B
To determine the year in which the firm showed the maximum percentage increase in its revenue with respect to the previous year, we will follow these steps:
Step 1: Gather Revenue Data
We need to extract the revenue data from the bar graph for the years provided. The revenue figures are as follows:
- 2009: 300 crore
- 2010: 260 crore
- 2011: 350 crore
- 2012: 320 crore
- 2013: 250 crore
- 2014: 340 crore
- 2015: 360 crore
- 2016: 370 crore
Step 2: Calculate Percentage Increase for Each Year
We will calculate the percentage increase in revenue for each year compared to the previous year using the formula:
Percentage Increase=(Revenue in Current Year−Revenue in Previous YearRevenue in Previous Year)×100
Step 3: Calculate for Each Year
1. From 2009 to 2010:
Percentage Increase=(260−300300)×100=(−40300)×100=−13.33%
2. From 2010 to 2011:
Percentage Increase=(350−260260)×100=(90260)×100≈34.62%
3. From 2011 to 2012:
Percentage Increase=(320−350350)×100=(−30350)×100≈−8.57%
4. From 2012 to 2013:
Percentage Increase=(250−320320)×100=(−70320)×100≈−21.88%
5. From 2013 to 2014:
Percentage Increase=(340−250250)×100=(90250)×100=36%
6. From 2014 to 2015:
Percentage Increase=(360−340340)×100=(20340)×100≈5.88%
7. From 2015 to 2016:
Percentage Increase=(370−360360)×100=(10360)×100≈2.78%
Step 4: Identify Maximum Percentage Increase
Now, we will compare all the calculated percentage increases:
- 2009 to 2010: -13.33%
- 2010 to 2011: 34.62%
- 2011 to 2012: -8.57%
- 2012 to 2013: -21.88%
- 2013 to 2014: 36%
- 2014 to 2015: 5.88%
- 2015 to 2016: 2.78%
The maximum percentage increase is 36% from 2013 to 2014.
Conclusion
The year in which the firm showed the maximum percentage increase in its revenue with respect to the previous year is 2014.
---
We need to extract the revenue data from the bar graph for the years provided. The revenue figures are as follows:
- 2009: 300 crore
- 2010: 260 crore
- 2011: 350 crore
- 2012: 320 crore
- 2013: 250 crore
- 2014: 340 crore
- 2015: 360 crore
- 2016: 370 crore
We will calculate the percentage increase in revenue for each year compared to the previous year using the formula:
1. From 2009 to 2010:
Percentage Increase=(260−300300)×100=(−40300)×100=−13.33%
Percentage Increase=(350−260260)×100=(90260)×100≈34.62%
Percentage Increase=(320−350350)×100=(−30350)×100≈−8.57%
Percentage Increase=(250−320320)×100=(−70320)×100≈−21.88%
Percentage Increase=(340−250250)×100=(90250)×100=36%
Percentage Increase=(360−340340)×100=(20340)×100≈5.88%
Percentage Increase=(370−360360)×100=(10360)×100≈2.78%
Now, we will compare all the calculated percentage increases:
- 2009 to 2010: -13.33%
- 2010 to 2011: 34.62%
- 2011 to 2012: -8.57%
- 2012 to 2013: -21.88%
- 2013 to 2014: 36%
- 2014 to 2015: 5.88%
- 2015 to 2016: 2.78%
The year in which the firm showed the maximum percentage increase in its revenue with respect to the previous year is 2014.
Similar Questions
Direction : Study the following bar diagram carefully and answer the four questions.
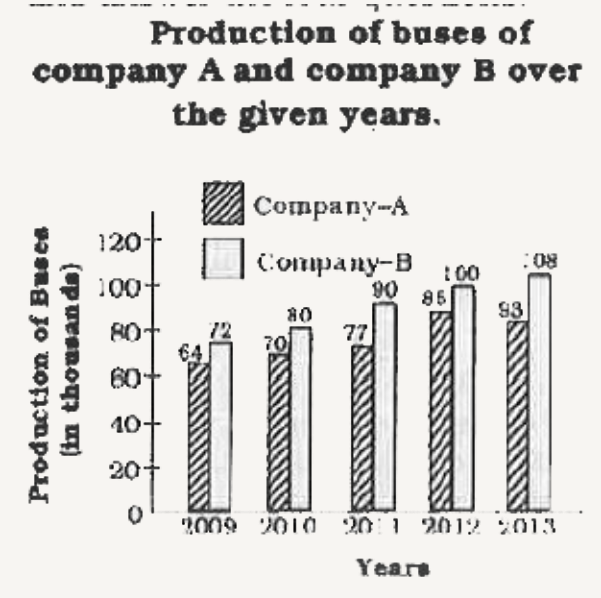
In which year for the company A the percentage increase of production of buses with respect to the previous year is maximum?
View SolutionIn which year was there maximum percentage increase in export of pearls to that in the previous year? (a) 2002 (b) 2007 (c) 2005 (d) 2004
View Solution
Knowledge Check
The bar graph given below represents the revenue of a firm for 8 years. All the revenue figures have been shown in terms of Rs. crores.
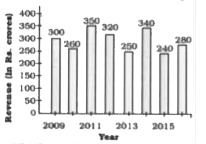
In which year the firm has shown maximum percentage with respect to the previous year ?Aa)2011Bb)2014Cc)2016Dd)All are equalDirection : Study the following bar diagram carefully and answer the four questions.

In which year for the company A the percentage increase of production of buses with respect to the previous year is maximum?A2010B2012C2011D2013Study the following graph carefully and answer the questions given below it -----
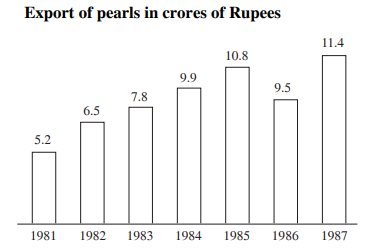
In which year there was maximum percentage increase in export of pearls to that in the previous year ?A1982B1987C1985D1984
Study the following bar graph and answer the question that follows.
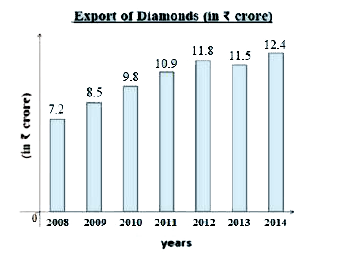
In which year was the maximum percentage increase in diamond exports compared to the previous year?
View SolutionThe following table shows the annual profit of a company (in Rs. lakh).

The period which has the maximum percentage increase in profit over the previous year is:
View SolutionStudy the following graph and answer the given questions
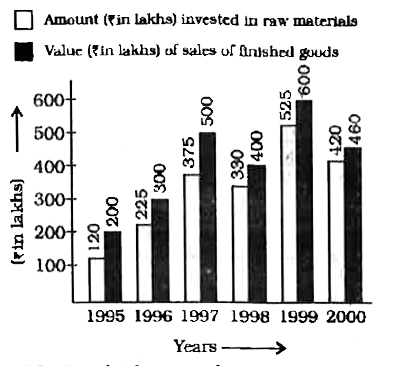
In which year, there has been a maximum percentage increase in the amount invested in raw materials as compared to the previous year ?
View SolutionStudy the following table carefully to answer these questions :
Income and expenditure of company A during the period 2001 to 2006.
Profit/Loss = Income - Expenditure
% Profit/Loss = Income - ExpenditureExpenditure×100
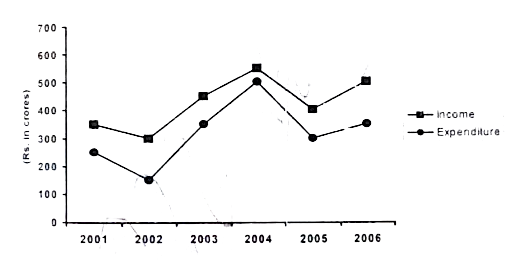
Which of the following years has the maximum percent increase/decrease in income from the previous year ?
View SolutionStudy the following graph carefully and answer the questions given below –
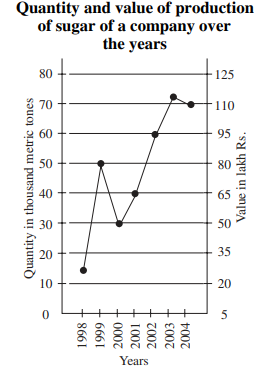
In which of the following years was the percentage increase in value of sugar per metric ton from the previous year the maximum?
View Solution
