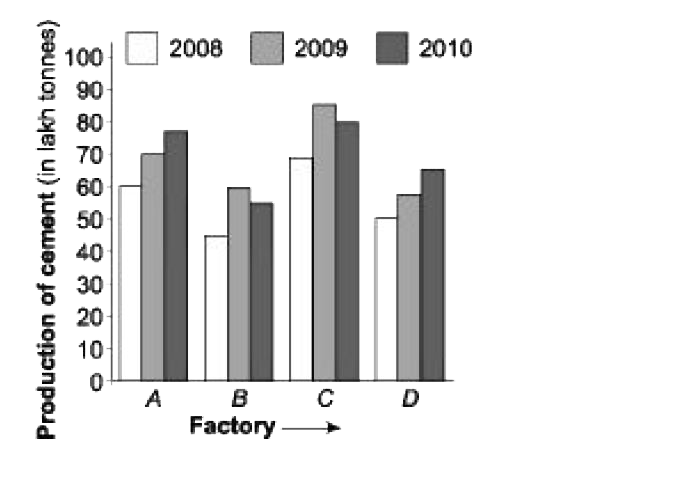
The following graph shows the production of cement (in lakh tons) of four factories A, B, C and D over the years
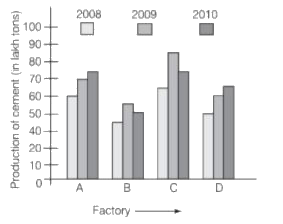
The production of cement by factory B in 2009 and production of cement by factory D in 2010 together is what per cent of production by factory A in 2008 ?
200
50
100
150
The correct Answer is:A
Step by step video & image solution for The following graph shows the production of cement (in lakh tons) of four factories A, B, C and D over the years The production of cement by factory B in 2009 and production of cement by factory D in 2010 together is what per cent of production by factory A in 2008 ? by Maths experts to help you in doubts & scoring excellent marks in Class 14 exams.
Updated on:21/07/2023Similar Questions
The following graph shows the production of cement (in lakh tons) of four factories A, B, C and D over the years
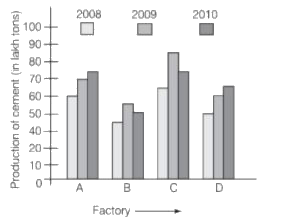
The percentage increase in production of cement by factory B from 2008 to 2009 is about
View SolutionThe following graph shows the production of cement (in lakh tons) of four factories A, B, C and D over the years
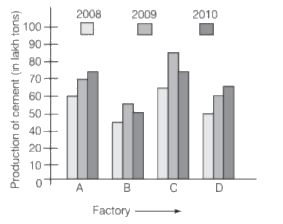
The defference (in lakh tons) between the average production of cement by four factories in 2009 and average production by the same factories in 2008 is
View Solution
Knowledge Check
The difference (in lakh tonnes) between the average production of cement by four factories in 2009 and average production by the same factories in 2008 is
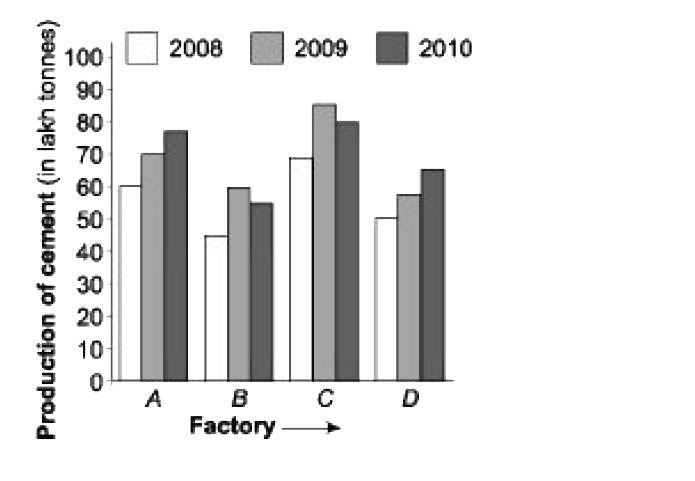 A12.75B11.5C11.75D12.5
The percentage increase in production of cement by factor B from 2008 to 2009 is about
 A30.8B16.7C18.2D22.2
The following graph shows the production of cotton cloth (in lakh metres) by three companies A, B and C over the years.
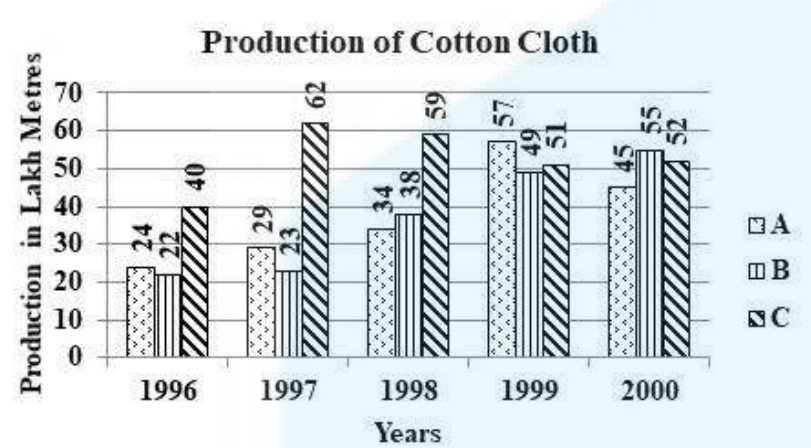
What is the ratio of the production of Company C in the years 1996 and 1997 to the production of Company B in the years 1999 and 2000?A3:11B51:52C11:3D52:51
The following graph shows the production of cement (in lakh tons) of four factories A, B, C and D over the years
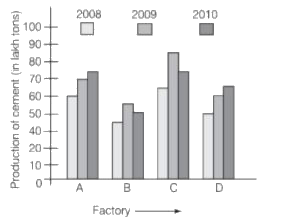
Which of the four factories has recorded the maximum percentage growth in production of cement from 2008 to 2009 ?
View SolutionThe following graph shows the production of cement (in lakh tons) of four factories A, B, C and D over the years
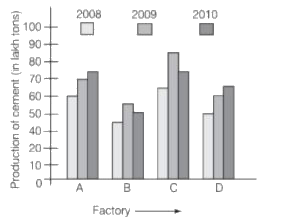
Which of the given factories has recorded the maximum percentage growth in production of cement from 2009 to 2010 ?
View SolutionThe following graph shows the production of cotton bales of 100 kg each (in lakhs) by different states A, B, C, D and E over the years. Study the graph and answer the following Questions.
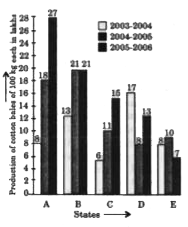
The production of State C in 2003-2004 is how many times its production in 2005-2006 ?
View SolutionThe following graph shows the demand and production of cotton by 5 companies A, B, C, D and E. Study the graph and answer question
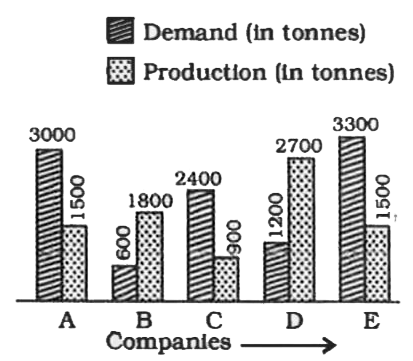
The production of company D is how many times that of the production of the company A?
View SolutionThe following graph shows the production of cotton bales of 100 kg each in lakhs by different states A, B, C, D and E over the years. Study the graph and answer the following Questions.
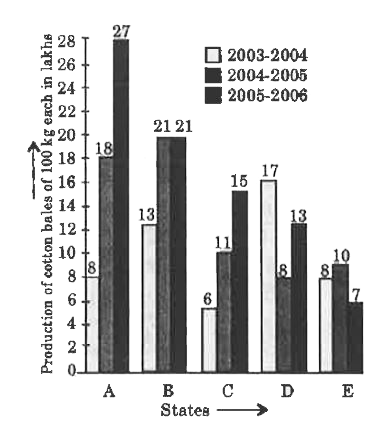
The production of State C in 2003-2004 is how many times its production in 2005-2006 ?
View Solution
