In the following pie charts percentage of student studied A,B,C and D in year 2014 and 2015 are shown.
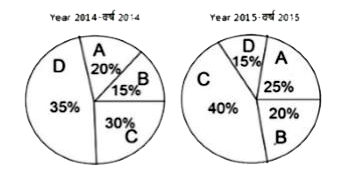
Total students in year 2014 and year 2015 are 3600 and 4000 respectively.
What is the ratio of number of students who studied subject A and B in year 2014 and the number of students who studied subject A and D in year 2015.
99:80
9:10
63:80
63:59
The correct Answer is:C
Step by step video, text & image solution for In the following pie charts percentage of student studied A,B,C and D in year 2014 and 2015 are shown. Total students in year 2014 and year 2015 are 3600 and 4000 respectively. What is the ratio of number of students who studied subject A and B in year 2014 and the number of students who studied subject A and D in year 2015. by Maths experts to help you in doubts & scoring excellent marks in Class 14 exams.
Similar Questions
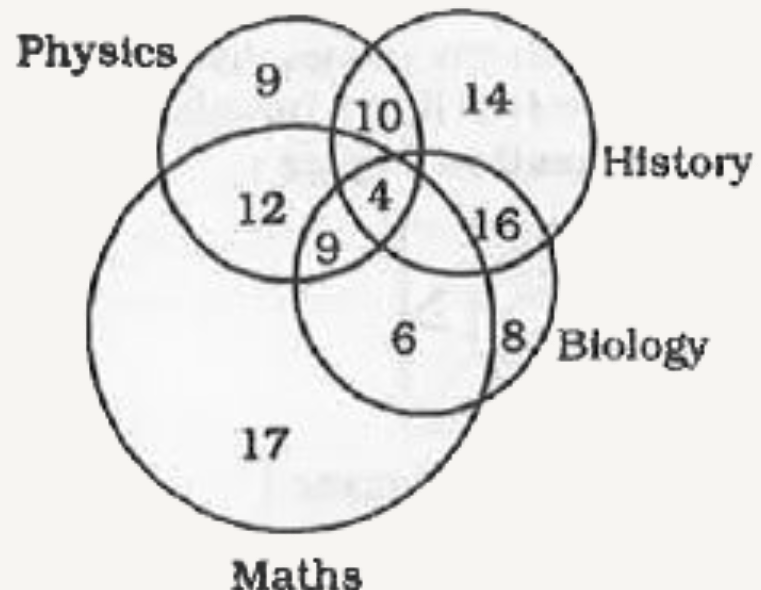
The diagram represents the number of students studying different subjects. What is the number of students who study History and Biology?
 View Solution
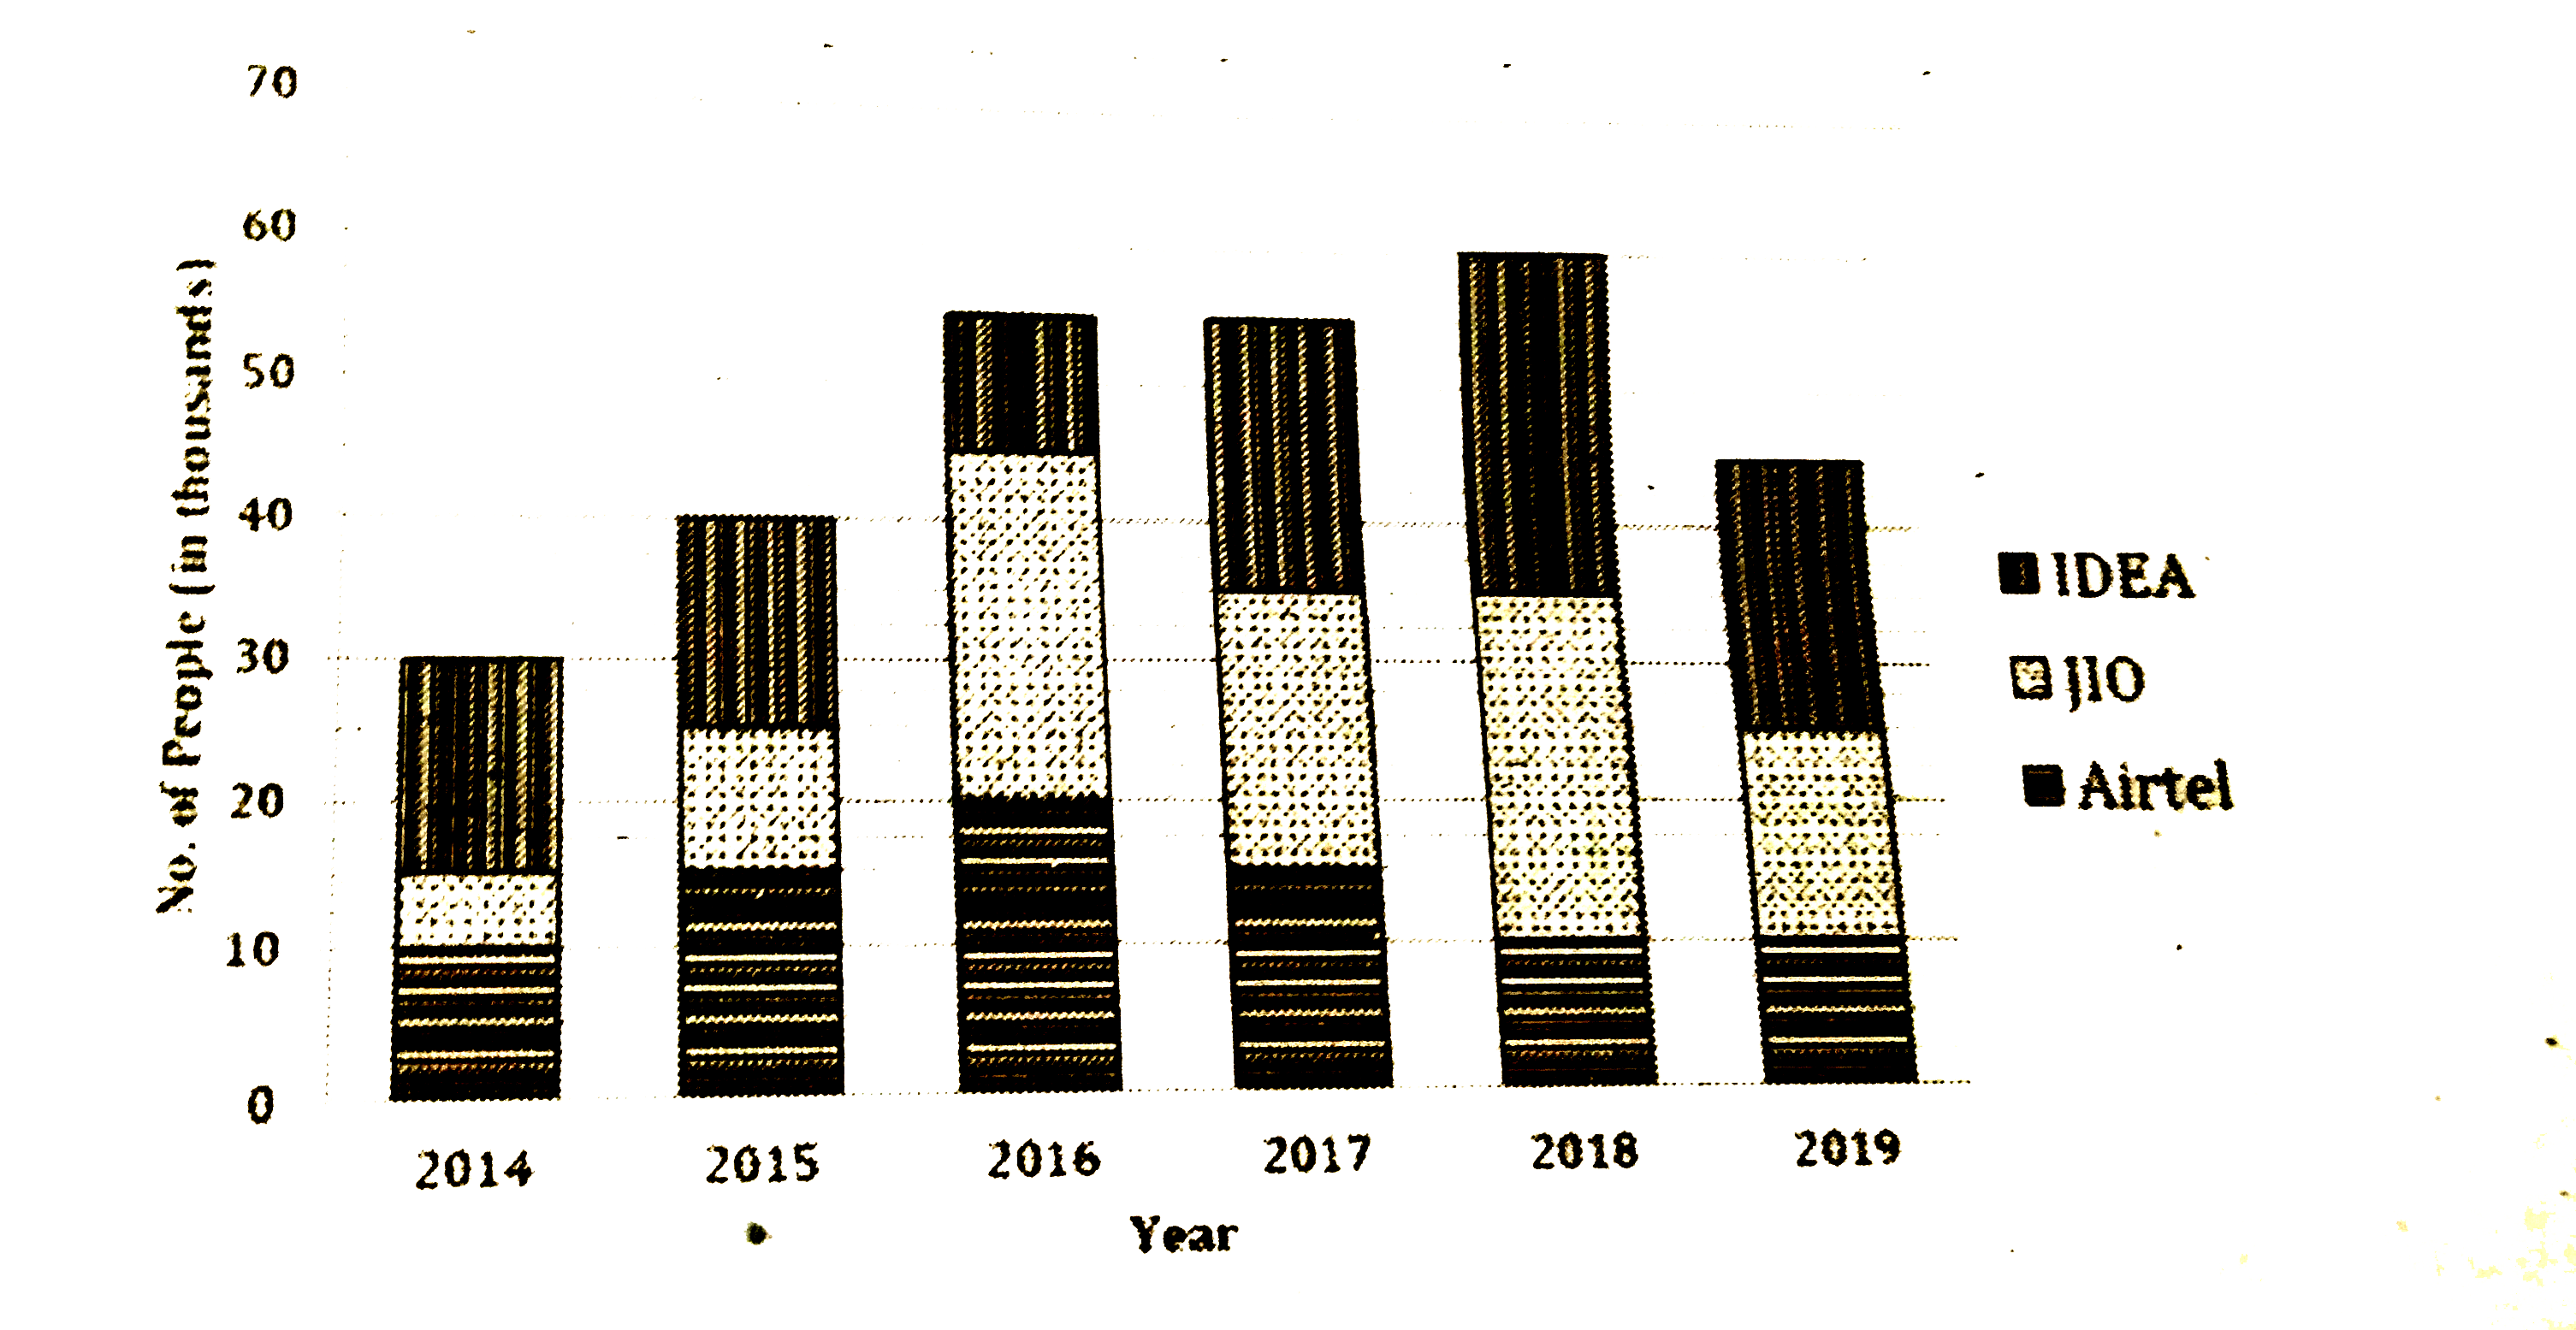
What is the ratio of the number of people using mobile service of AIRTEL in the year 2015 to that of whose using the same service in the year 2014 ?View Solution
Knowledge Check
- Question 1 - Select One
The table below shows the number of students enrolled in five colleges over the five years (2010 to 2014).
यह तालिका पांच कॉलेजों में पांच वर्षों ( 2010 से 2014 ) के दौरान नामांकन लेने वाले छात्रों की संख्या दर्शाती है |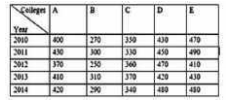 What is the ratio of the total students enrolled in colleges A and B in the year 2012 to the total students enrolled in colleges D and E in the year 2013?
वर्ष 2012 में कॉलेज A और B में नामांकन लेने वाले कुल छात्रों की संख्या का वर्ष 2013 में कॉलेज D और E में नामांकन लेने वाले कुल छात्रों की संख्या के साथ अनुपात ज्ञात करें|A72:85B62:88C73:86D58:63 - Question 2 - Select One
What is the respective ratio of the number of students passed from university A in the year 2007 and the number of student passed from university B in the year 2004?
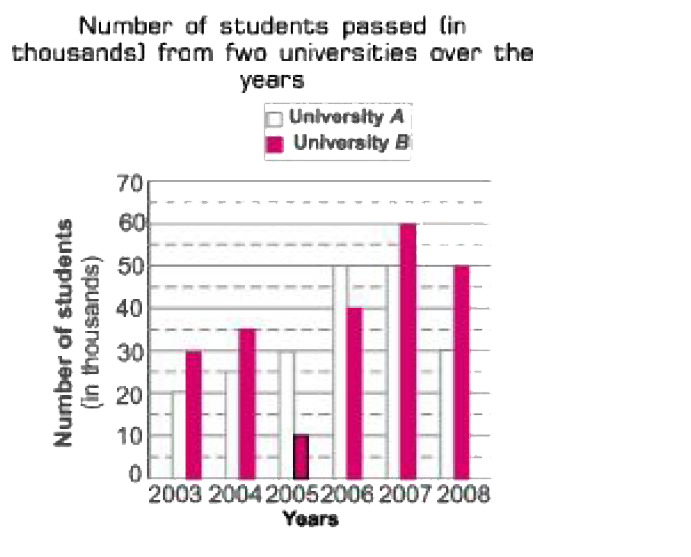 A5:4B4:5C7:10D10:7
 - Question 3 - Select One
What is the ratio of the number of students passing to those falling from college E in the year 2015?
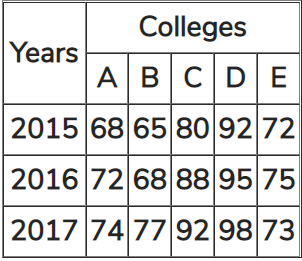 A4:3B18:7C9:5D17:7
The following bar graph shows the number of students (in hundreds) who have opted for different courses A, B, C and D in 3 years in a college. Study the graph and answer the question.
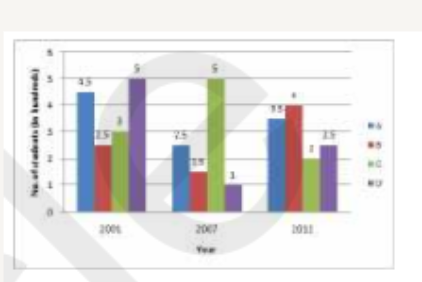 What is the ratio of the number of students who were admitted to course A in the year 2007 to that
of students who were admitted to course C in the year 2012? View Solution
What is the ratio of the number of students who were admitted to course A in the year 2007 to that
of students who were admitted to course C in the year 2012? View SolutionThe following graph below shows the number of students (in thousands) who were admitted to three different courses in 5 years in a university. Study the graph and answer the question.
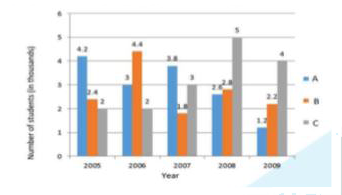
What is the ratio of the number of students who were admitted to course A in the year 2007 to that of students who were admitted to course C in the year 2009?View SolutionWhat is the ratio of the total numbers of students enrolled in A during 2015 and 2018 to that of students enrolled in B during 2014 and 2016.
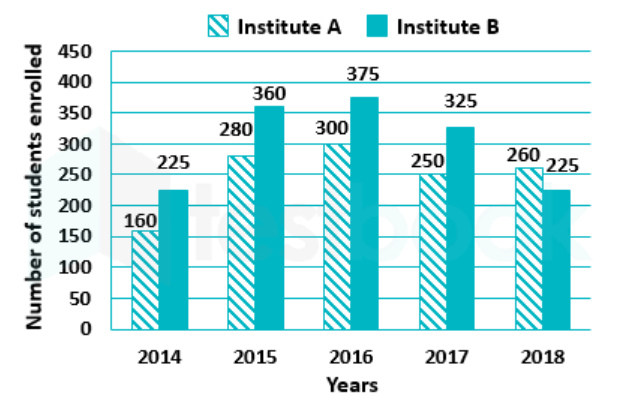 View Solution
The line chart given below shows the number of students in 2 sections X and Y from year 2009 to 2016.
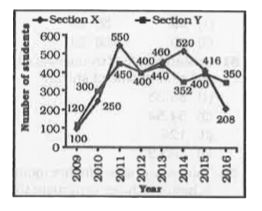
What is the average number of students in section X from year 2009 to year 2014?View SolutionThe table below shows the number of students enrolled in five colleges over the five years
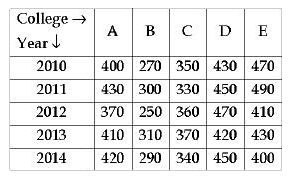
In the year 2014 what percent of students were enrolled in college CView Solution

