Following is a data regarding export and import of a company over the years. Answer the question given below.
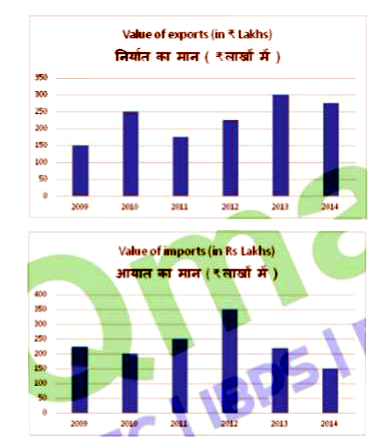
What was the percentage increase in imports fromyear 2011 to 2012?
Step by step video, text & image solution for Following is a data regarding export and import of a company over the years. Answer the question given below. What was the percentage increase in imports fromyear 2011 to 2012? by Maths experts to help you in doubts & scoring excellent marks in Class 14 exams.
Similar Questions
Following is a data regarding export and import of a company over the years. Answer the question given below.
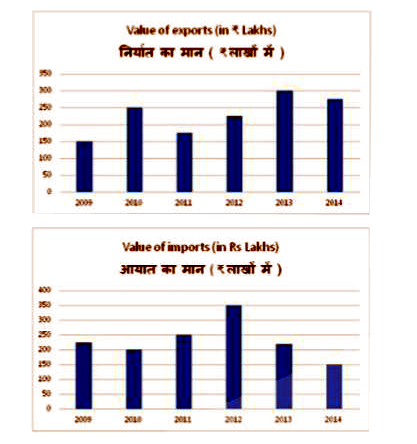
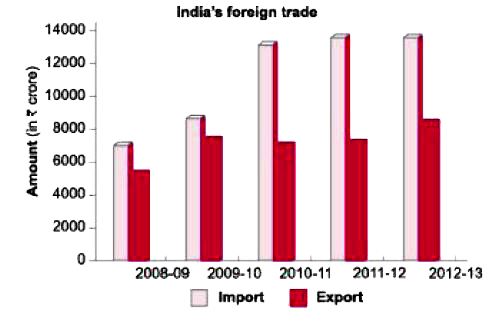
The value of imports in year 2011 was what percentage (approximate) of the average value of exports in the years 2009, 2010 and 2011?View SolutionWhat is the percentage increase in import between 2008-09 and 2012-13?
 View Solution
Knowledge Check
- Question 1 - Select One
Following is a data regarding export and import of a company over the years. Answer the question given below.
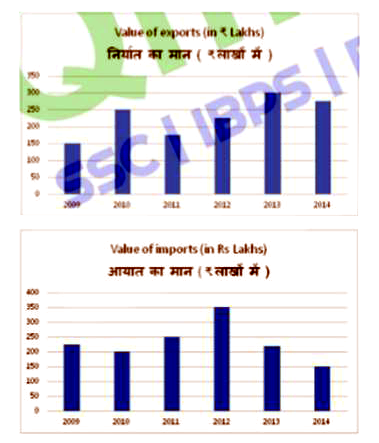
What was the percentage decline in the value of exports from 2010 to 2011?A30%B17%C25%D3% - Question 2 - Select One
Following is a data regarding export and import of a company over the years. Answer the question given below.
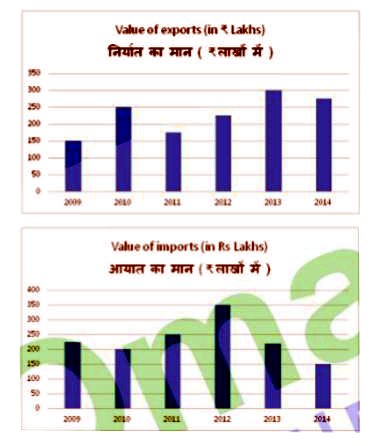
In which year the difference between the imports and exports was minimum?A2009B2014C2010D2012 - Question 3 - Select One
Study the following graph carefully and answer the questions given below it -----
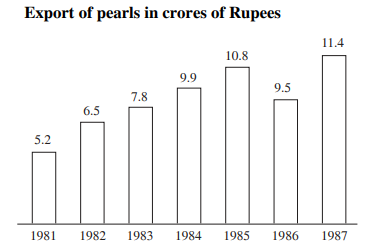
What was the percentage increase in export from 1986 to 1987 ?A1623%B20%C19%D3313%
Study the following bar-diagram carefully and answer the questions.
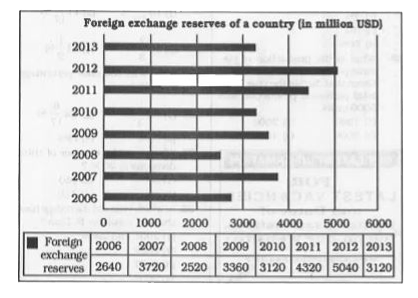
What was the percentage increase in the foreign reserve in 2012 over 2008?View SolutionStudy the given data and answer the questions that follow
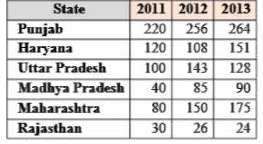
What was the percentage increase of land under cultivation in Punjab in 03 the year 2013 as against 2011?View SolutionThe following graph shows the production of wheat flour (in 1000 tonnes) by three companies X, Y and Z over the years. Study the graph and answer the questions.
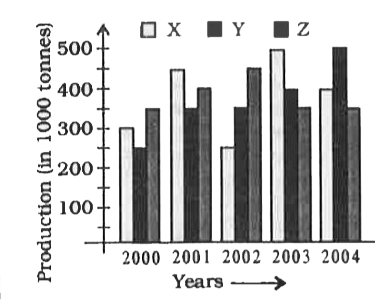
What is the percentage Increase in the production of company Y from 2002 to 2003?View SolutionThe following line graph gives the ratio of the amounts of imports by a company to the amount of exports from that company over the period from 1995 to 2001.
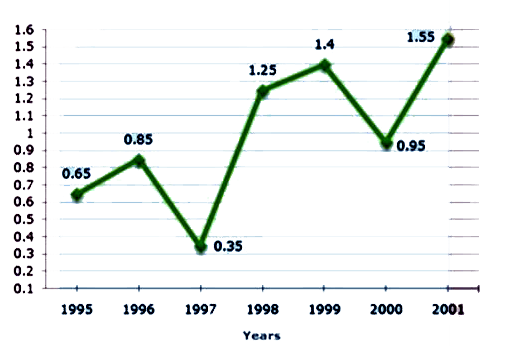
What was the percentage increase in imports from 1997 to 1998 ?View SolutionStudy the following bar graph and answer the question that follows.
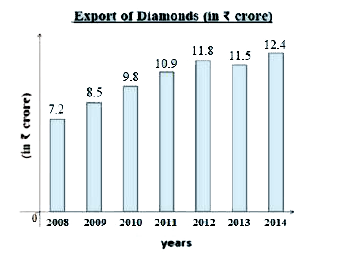
In which year was the maximum percentage increase in diamond exports compared to the previous year?View Solution

