Refer to the given food chain operating in an ecosystem.

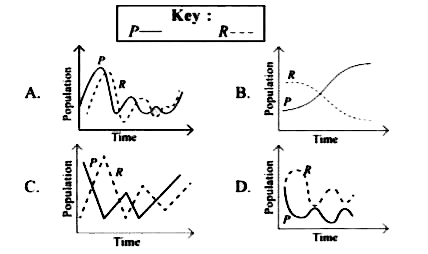
A population of organism X is introduced in this community which exclusively feeds on Q. Which of the following graphs correctly shows the changes in populations of P and R over time?

Video Solution
Text Solution
The correct Answer is:B
Organism X feeds on Q and if X is introduced in the given food chain, population of P will increase over time as organism Q.s population will decrease (which feeds on P). Population of R will decrease due to decreased population of Q.
|
Updated on:21/07/2023
Topper's Solved these Questions
- BOOK - SCIENCE OLYMPIAD FOUNDATION CHAPTER - NSO QUESTION PAPER 2017- 18 SET - BEXERCISE - ACHIEVERS SECTION2videos
NSO QUESTION PAPER 2017- 18 SET - B
- BOOK - SCIENCE OLYMPIAD FOUNDATION CHAPTER - NSO QUESTION PAPER 2018- 19 SET - BEXERCISE - ACHIEVERS SECTION3videos
NSO QUESTION PAPER 2018- 19 SET - B
Similar Questions
Knowledge Check
- Question 1 - Select One
Which one of the following has the largest population in a food chain?
AProducersBdecomposersCPrimary consumersDSecondary consumers - Question 2 - Select One
Which one of the following has the largest population in a food chain ?
AProducersBPrimary consumersCSecondary consumersDDecomposers - Question 3 - Select One
Which one of the following has the largest population in a food chain?
ASecondary ConsumersBPrimary ConsumersCDecomposersDProducers
Which one of the following has the largest population in a food chain?
View SolutionWhich of the following graphs correctly depicts the rate of photosynthesis of sun plant (P) and shade plant (Q)?
View SolutionWhich one of the following has the largest population in a food chain ?
View SolutionThe given diagram shows a chromosome
Which of the following table refers correctly to the chromosome
 View Solution
Which of the following is a measure of environmental resources that can sustain a population over a long period of time ?
View Solution

