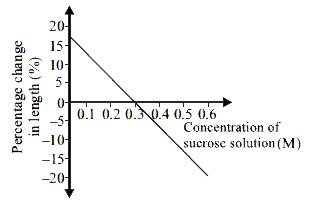
Potato tuber strips measuring 5 cm were prepared and placed in Petri dishes filled with varying concentrations of sucrose solution (0.0M to 0.6M). After 20 minutes, their final lengths were recorded and their percentage change in length calculated. The graph below shows the percentage change in length of potato strips in increasing concentrations of sucrose solution.

Which of the following can be correctly in ferred from the given graph?
0.3 M sucrose solution is isotonic to cell sap of potato cells.
Negative percentage change in potato strip length is due to endosmosis.
Positive percentage change in potato strip length is due to exosmosis.
0.6 M sucrose solution is hypotonic and 0.2 M sucrose solution is hypertonic to cell sap of potato cells.
The correct Answer is:A
Step by step video, text & image solution for Potato tuber strips measuring 5 cm were prepared and placed in Petri dishes filled with varying concentrations of sucrose solution (0.0M to 0.6M). After 20 minutes, their final lengths were recorded and their percentage change in length calculated. The graph below shows the percentage change in length of potato strips in increasing concentrations of sucrose solution. Which of the following can be correctly in ferred from the given graph? by Biology experts to help you in doubts & scoring excellent marks in Class 9 exams.
Topper's Solved these Questions
- BOOK - SCIENCE OLYMPIAD FOUNDATION CHAPTER - NSO QUESTION PAPER 2016 SET BEXERCISE - ACHIEVERS SECTION2videos
NSO QUESTION PAPER 2016 SET B
- BOOK - SCIENCE OLYMPIAD FOUNDATION CHAPTER - NSO QUESTION PAPER 2016 SET A EXERCISE - ACHIEVERS SECTION2videos
NSO QUESTION PAPER 2016 SET A
- BOOK - SCIENCE OLYMPIAD FOUNDATION CHAPTER - NSO QUESTION PAPER 2017 SET A EXERCISE - ACHIEVERS SECTION2videos
NSO QUESTION PAPER 2017 SET A
Similar Questions
A wire has Piosson's ratio 0.3. If the change in the length of the wire on stretching it is 1% then percentage change in the volume of the wire will be
View SolutionA copper wire is stretched so as to increase its length by 0.2%. Calculate the percentage change in the resistance of the wire.
View Solution
Knowledge Check
- Question 1 - Select One
The length of a pendulum changes from 1m to 1.21m. The percentage change in its period is
A20%B21%C10%D11% - Question 2 - Select One
If length of the rectangle is increased by 50% and breadth is decreased by 20%. Then, what is the percentage change in the area?
A20% decreaseB20% increaseC80% increaseDNone of these - Question 3 - Select One
If length of the rectangle is increased by 50% and breadth is decreased by 20%. Then what is the percentage change in the area?
A20% decreaseB20% increaseC80% increaseDnone of these
A condutor of length l is stretched such that its length increases by 10 % calculate the percentage change in the resistance of the conductor.
View SolutionIf length of simple pendulum is increased by 6% then percentage change in the time-period will be
View SolutionThe wire is stretched to increase the length by 1%. Find the percentage change in the resistance.
View SolutionPoisson's ratio of a material is 0.5 percentage change in its length is 0.04% . What is change in percentage of diameter?
View SolutionThe pH of solution is 4.0 what should be the change in the hydrogen ion concentration of the solution if its pH is to be increased to 5.0
View Solution

