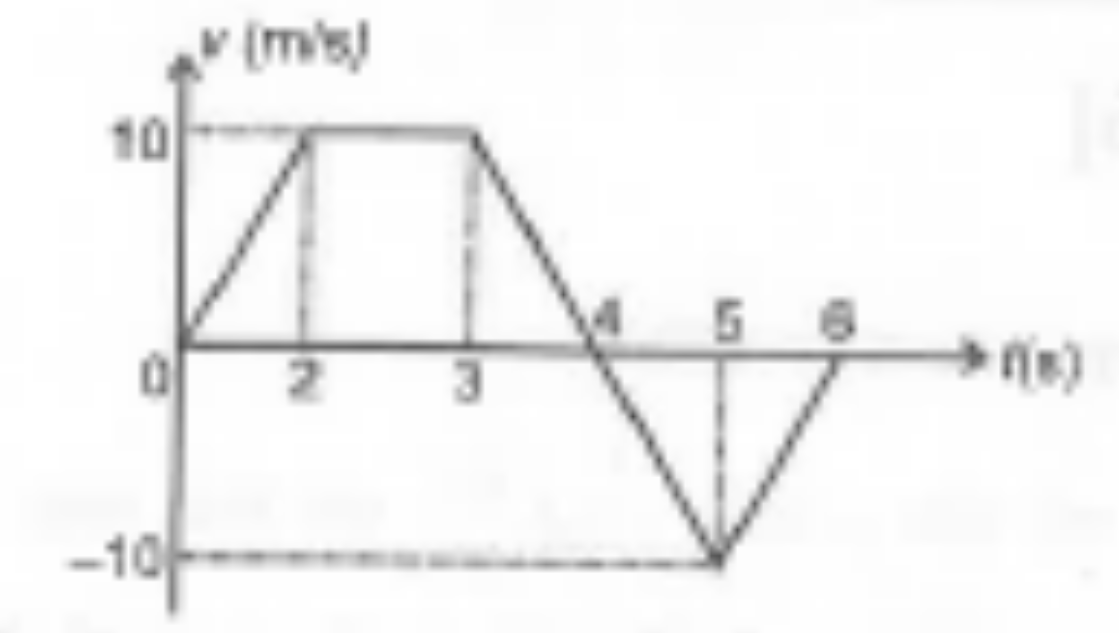
The velocity-time graph of a particle starting from rest and moving along a straight line is as shown in Fig. 4.1.34
When is the acceleration zero ?
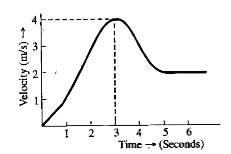
The slope is zero at 3s and for the interval from 5s to 6s.
Topper's Solved these Questions
- BOOK - ICSECHAPTER - DYNAMICSEXERCISE - SHORT ANSWER QUESTIONS WITH ANSWERES43videos
DYNAMICS
- BOOK - ICSECHAPTER - DYNAMICSEXERCISE - SHORT ANSWER QUESTIONS WITH ANSWERS12videos
DYNAMICS
- BOOK - ICSECHAPTER - DYNAMICSEXERCISE - VERY SHORT ANSWER QUESTIONS60videos
DYNAMICS
- BOOK - ICSECHAPTER - DIMENSIONSEXERCISE - SELECTED PROBLEMS (FROM CONVERSIONS OF ONE SYSTEMS OF UNITS INTO ANOTHER)9videos
DIMENSIONS
- BOOK - ICSECHAPTER - FRICTIONEXERCISE - Selected problems30videos
FRICTION
Similar Questions
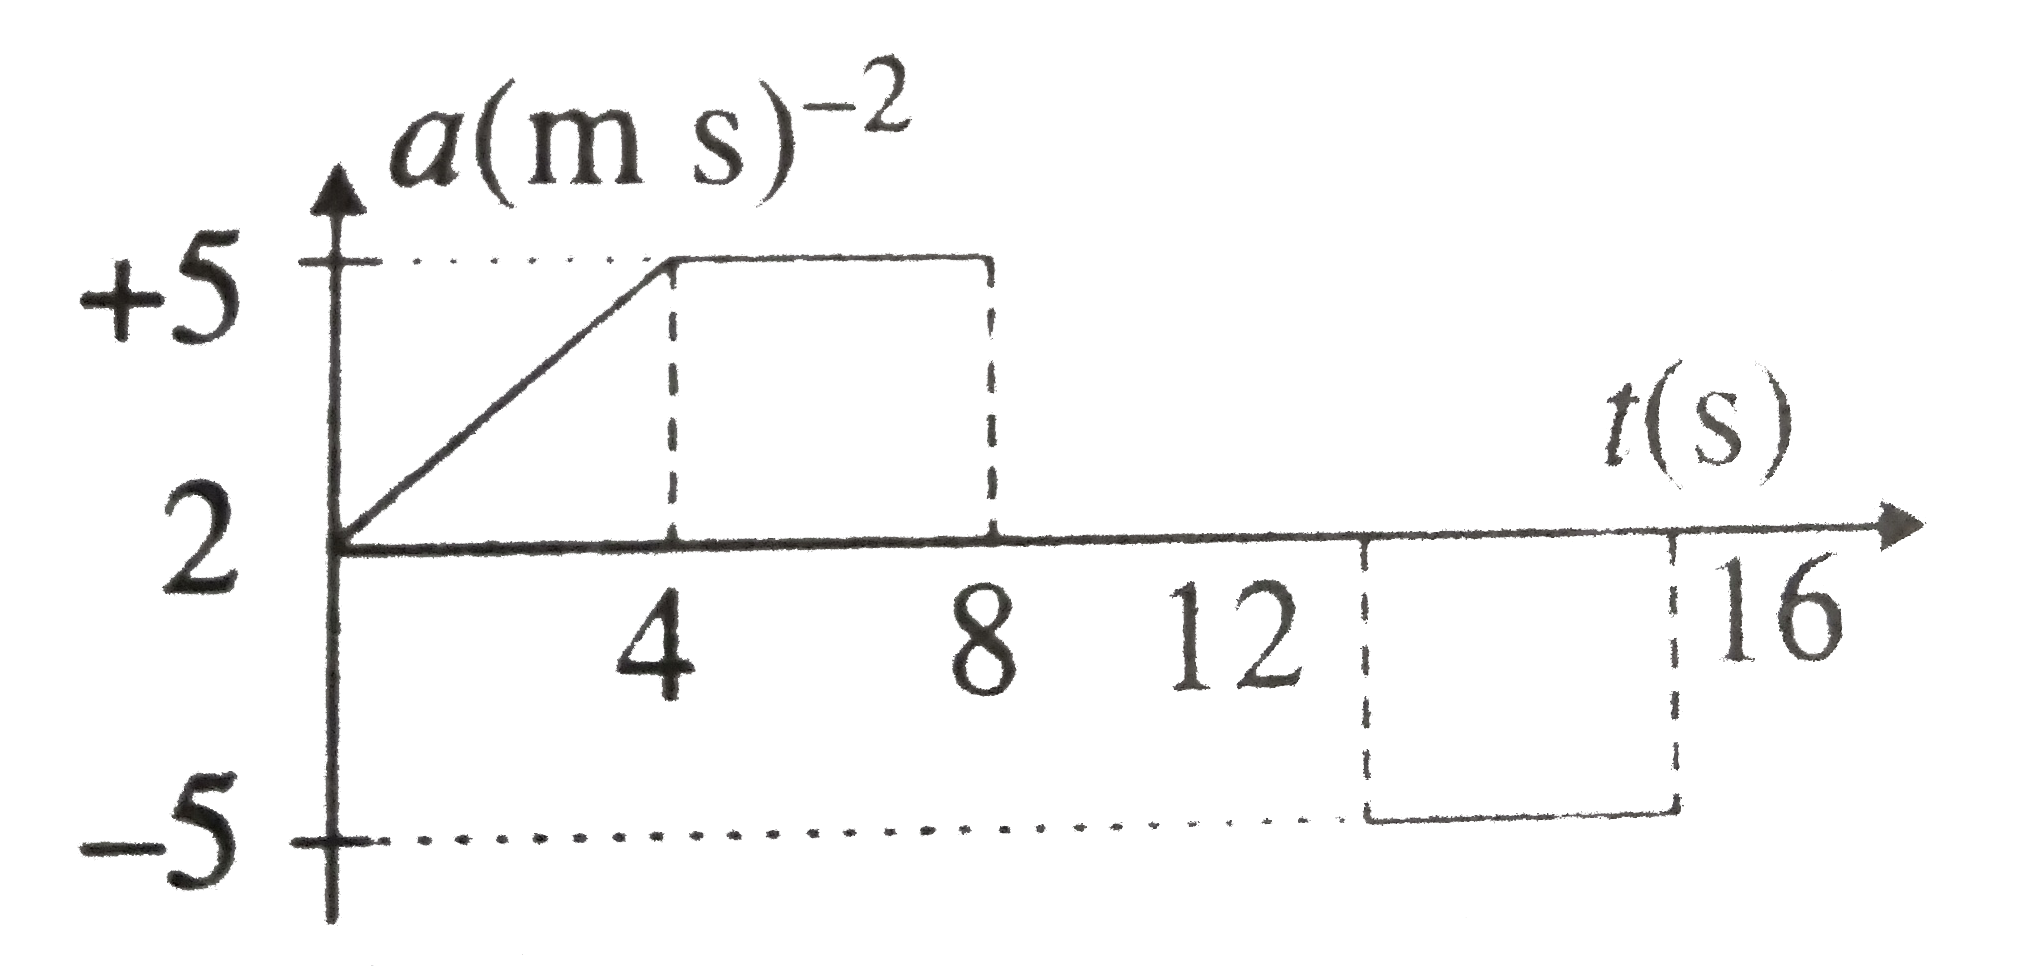
The acceleration of a particle starting from rest and travelling along a straight line is shown in figure. The maximum speed of the particle is
 View Solution
The velocity-time graph of a particle moving along a straight line is shown is Fig. The rate of acceleration and deceleration is constant and it is equal to 5ms−2. If the a average velocity during the motion is 20ms−1, Then
 .
.
The maximum velocity of the particle is .View SolutionThe velocity-time graph of a particle moving along a straight line is shown is Fig. The rate of acceleration and deceleration is constant and it is equal to 5ms−2. If the a average velocity during the motion is 20ms−1, Then
 .
.
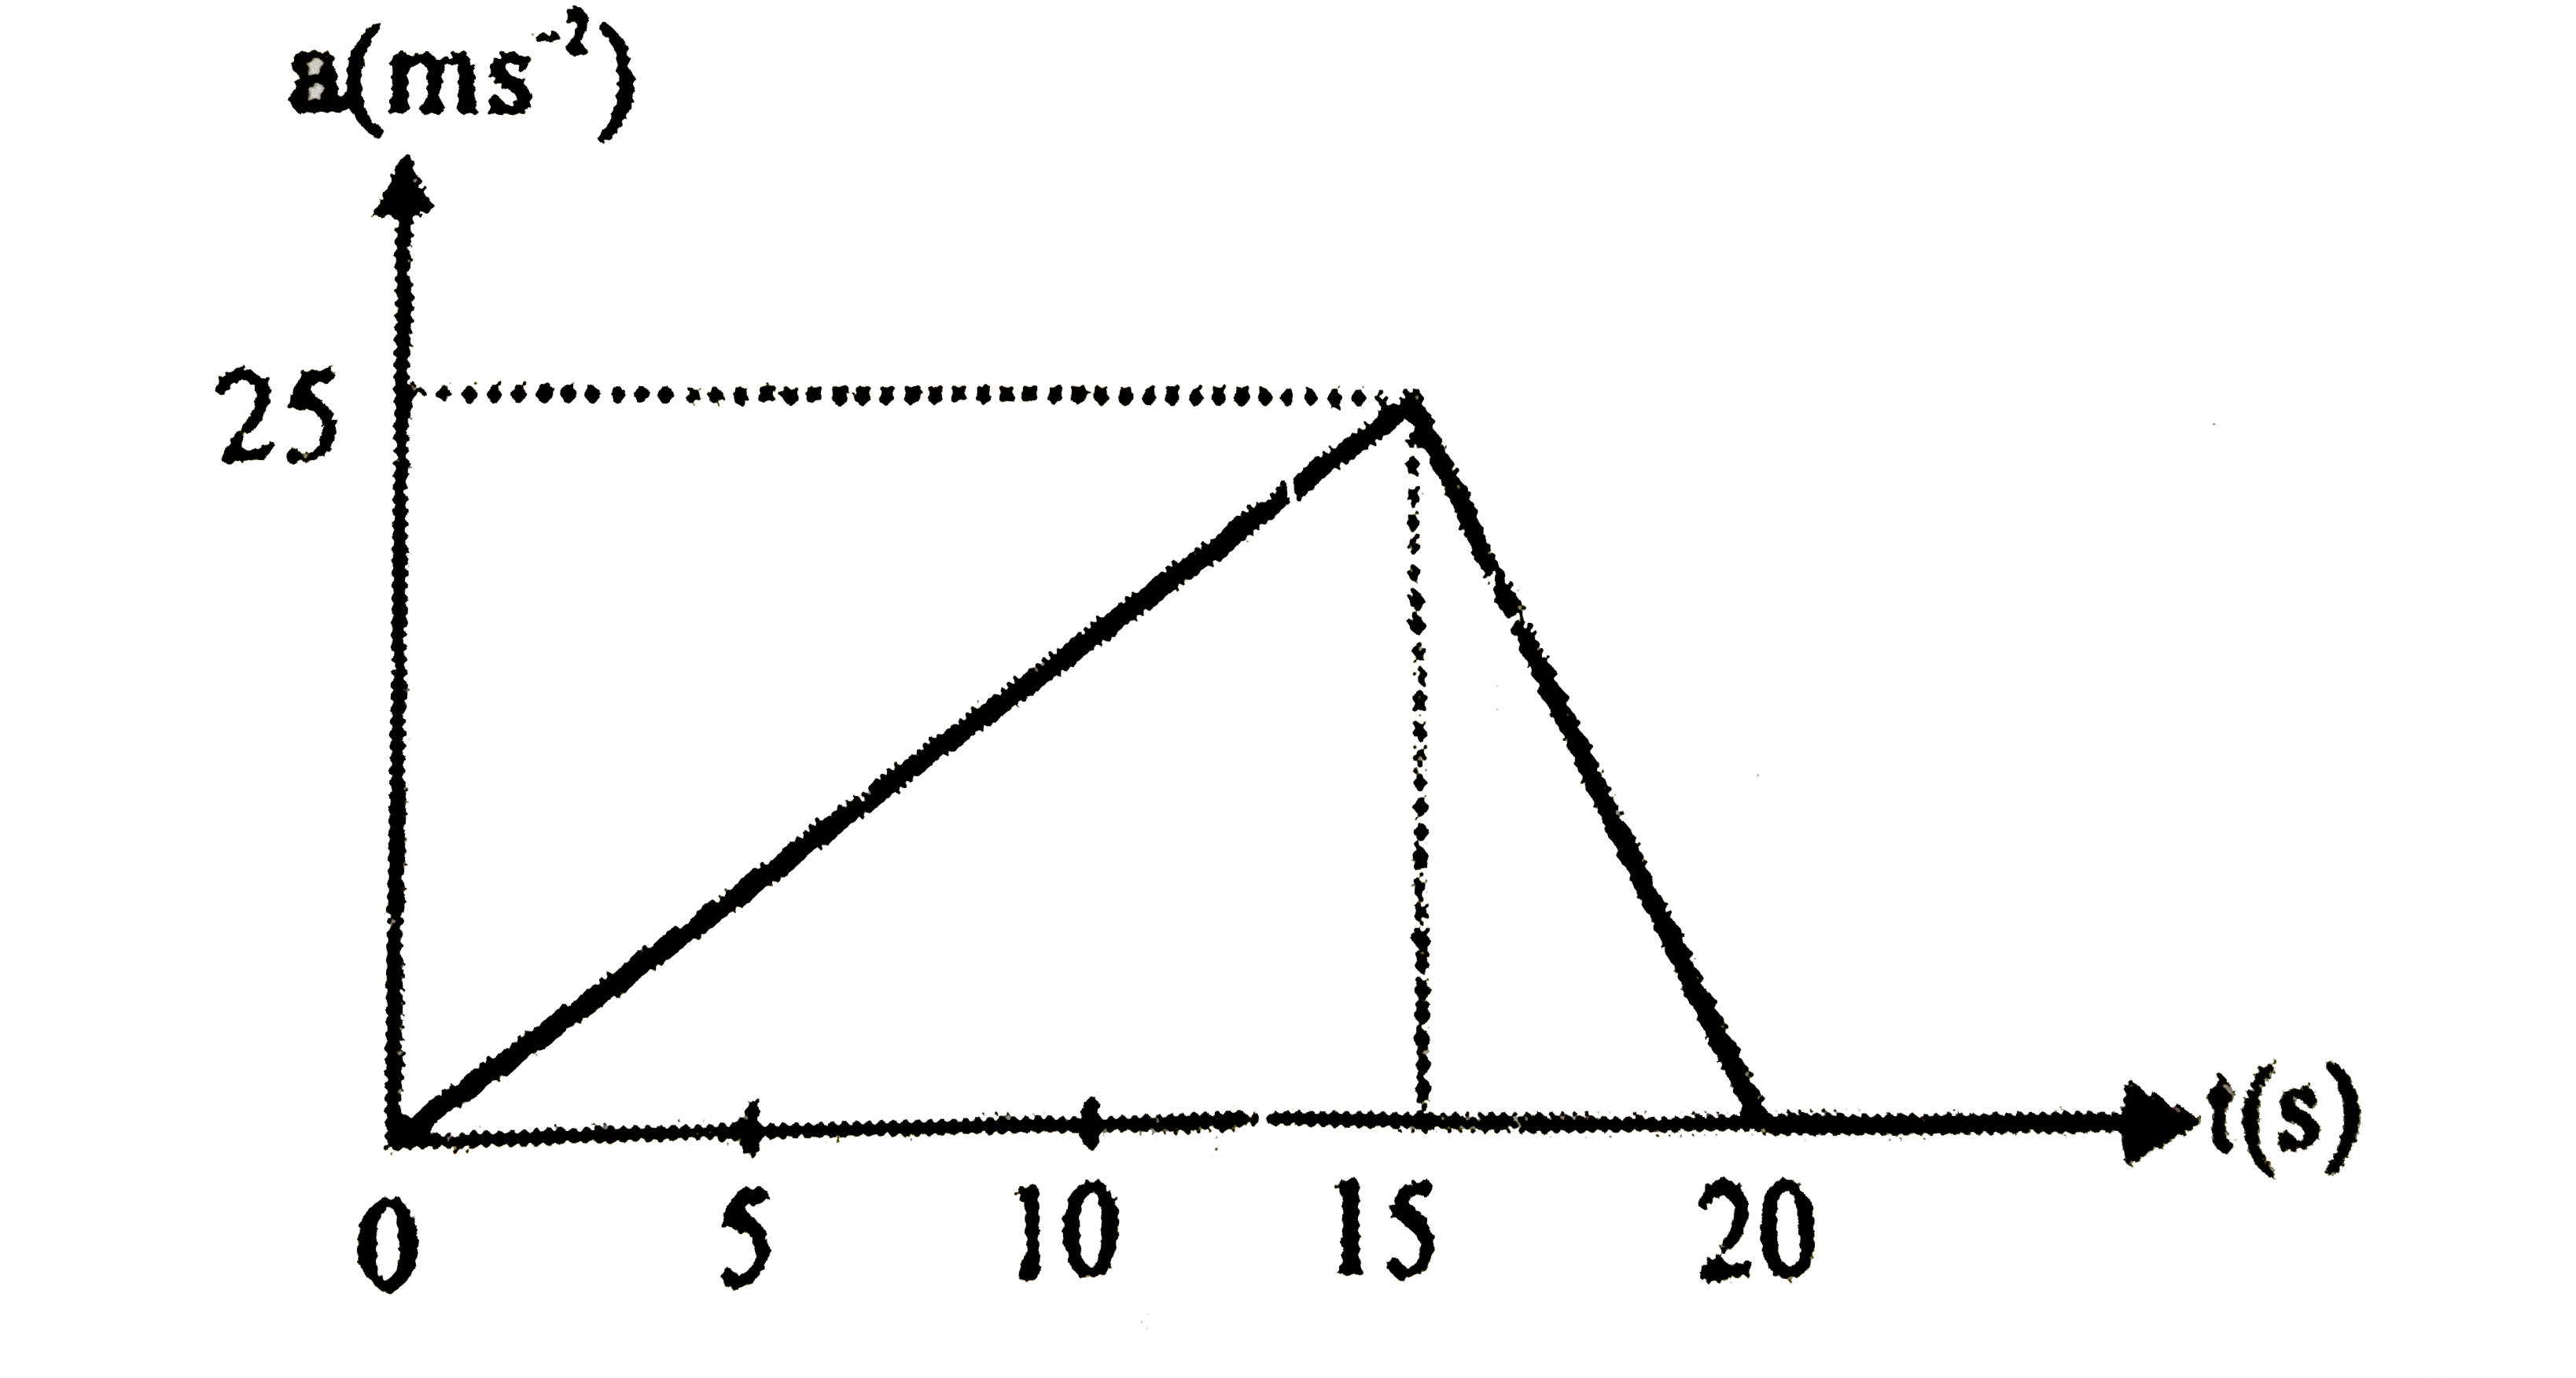
The maximum velocity of the particle is .View SolutionFigure shows acceleration versus time graph of a particle starting from rest and moving along a straight line. Which of the following staement (s) is/are correct ?
 View Solution
The velocity displacement graph of a particle moving along a straight line is shown in figure.
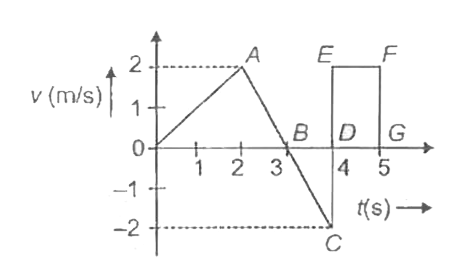
Then the acceleration displacement graph is.View SolutionThe velocity - time graph of a particle moving along a straight line is shown in the figure given below
The displacement of the particle in 5 second is
 View Solution
The velocity (v)-time (t) graph of a partide moving along a straight line is as shown in the figure. The displacement of the particle from t = 0 to t = 4 is
 View Solution
The velocity-time graph of a particle moving along a straight line is shown is . The rate of acceleration and deceleration is constant and it is equal to 5ms−2. If the a average velocity during the motion is 20ms−1, Then
 .
.
The value of t is.View SolutionVelocity displacement graph of a particle moving in a straight line is as shown in figure.
 View Solution
The variation of velocity of a particle moving along a straight line is shown in . is
 .View Solution

