The following table gives the test scores and sales by nine salesmen during last one year in a certain firm :

Compute the Karl Pearson's Coefficient of Correlation and interpret the result.
The correct Answer is:,
Topper's Solved these Questions
- CORRELATION ANALYSIS BOOK - ICSECHAPTER - CORRELATION ANALYSIS EXERCISE - EXERCISE (A)
13 Videos
- CORRELATION ANALYSIS BOOK - ICSECHAPTER - CORRELATION ANALYSIS EXERCISE - EXERCISE (B)
2 Videos
- CONIC SECTIONS BOOK - ICSECHAPTER - CONIC SECTIONS EXERCISE - Multiple Choice Questions
33 Videos
- CORRELATION ANALYSISBOOK - ICSECHAPTER - CORRELATION ANALYSISEXERCISE - Multiple Choice Question
7 Videos
Similar Questions
Calculate the karl pearson's coefficient of Correlation from the following data and interpret the result.

View SolutionCompute Karl Pearson's Coefficient of Correlation between sales and expenditures of a firm for six months. **
View SolutionThe mathematical aptitude score of 10 computer programmers with their job performance is given below :

Calculate the Spearman's coefficient of rank correlation and interpret the result.
View SolutionThe mathematical aptitude score of 10 computer programmers with their job performance is given below:

Calculate the Karl Pearson's correlation coefficient and interpret the result.
View SolutionThe following table shows the sales and advertisement expenditure of a firm

Correlation coefficient = 0.9 , estimate the likely sales for a proposed expenditure of ₹ 10 crores.
View SolutionFind out Pearson's coefficient correlation between the following X and Y series using the deviation scores from their respective arithmetic mean. Interpret the results.
View SolutionFrom the following data, compute Karl Pearson coefficient of correlation :

Summation of product of deviation of X and Y series from their respective means is 46
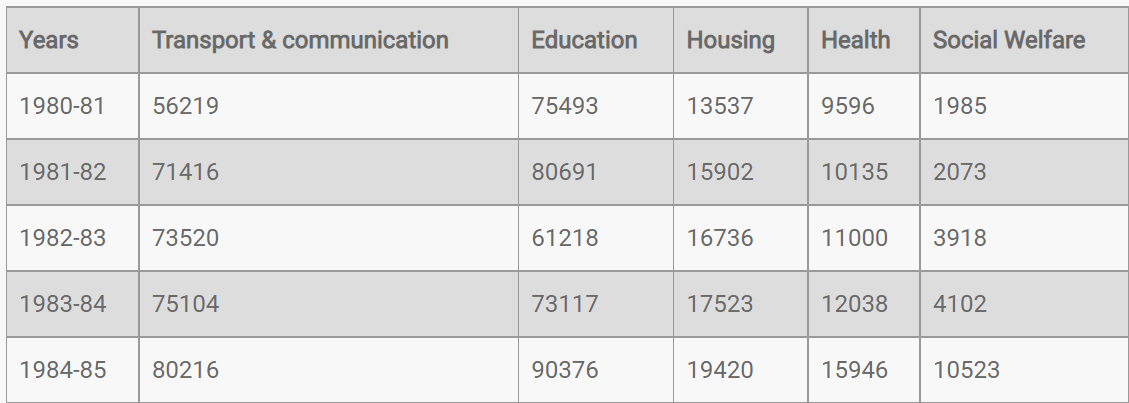
View SolutionThe following data give year wise outlay in lakhs of rupees in a certain 5 year plan (1980-1985) of a state ,under the heads :

Putting the data in the form of a table ,write the total under each head and answer the following question -----
During which year the outlay on education was maximum ?
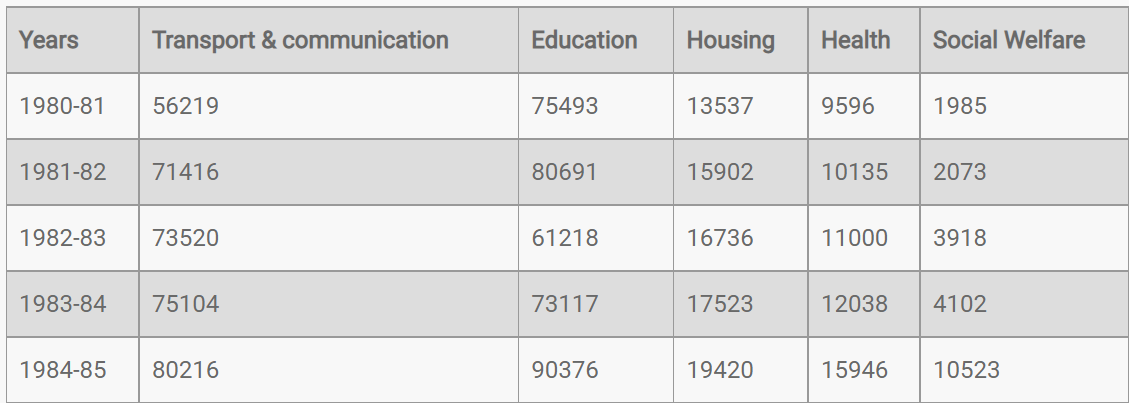
View SolutionThe following data give year wise outlay in lakhs of rupees in a certain 5 year plan (1980-1985) of a state ,under the heads :

Putting the data in the form of a table ,write the total under each head and answer the following question -----
What is the percentage increase during 1983-84 over 1982-83 in health outly ?
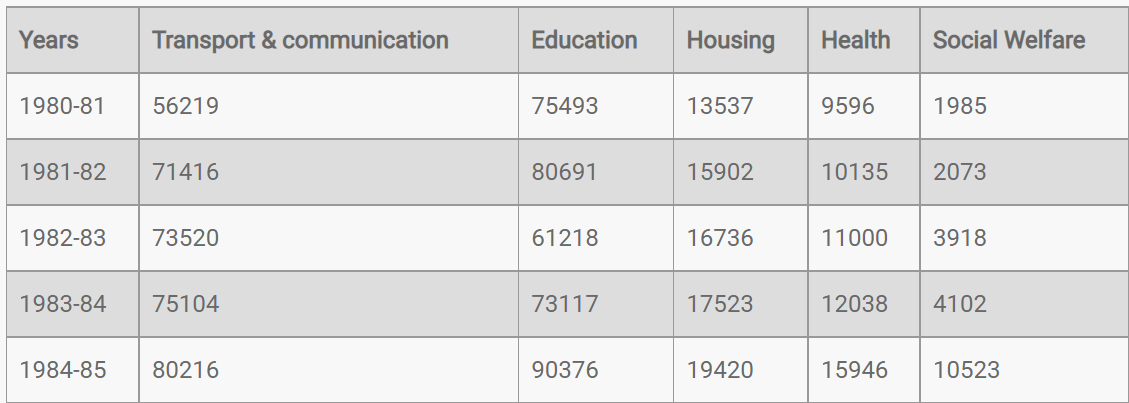
View SolutionThe following data give year wise outlay in lakhs of rupees in a certain 5 year plan (1980-1985) of a state ,under the heads :

Putting the data in the form of a table ,write the total under each head and answer the following question -----
What is total outlay on Social Welfare during the plan period __ (lakhs )?
View Solution
