Read the data in the table given below and answer the questions that follow.
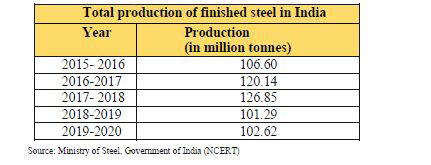
Compare the 2015-2016 and 2019-2020 data and give any one reason for the reduction of steel in 2019-2020.
Step by step video & image solution for Read the data in the table given below and answer the questions that follow. Compare the 2015-2016 and 2019-2020 data and give any one reason for the reduction of steel in 2019-2020. by Social Science experts to help you in doubts & scoring excellent marks in Class 10 exams.
Topper's Solved these Questions
Similar Questions
Knowledge Check
- Question 1 - Select One
Refer the following data table and answer the question.
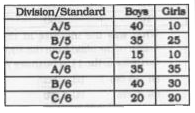
What is the ratio of boys to girls?A26:37B39:28C28:39D37:26 - Question 2 - Select One
Study the given graph and answer the question that follows.
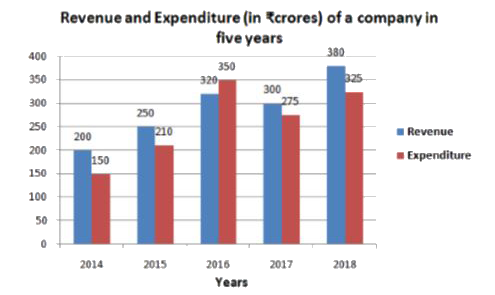
What is the ratio of the total expenditure in 2015 and 2016 to the total revenue of the company in 2016 and 2018?Aa) 4 : 5Bb) 19 : 20Cc) 6 : 7Dd)0.47222222222222 - Question 3 - Select One
Refer the following data table and answer the question.
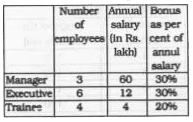
What is the average bonus (in rupees)?A606154B7880002C25333D224000
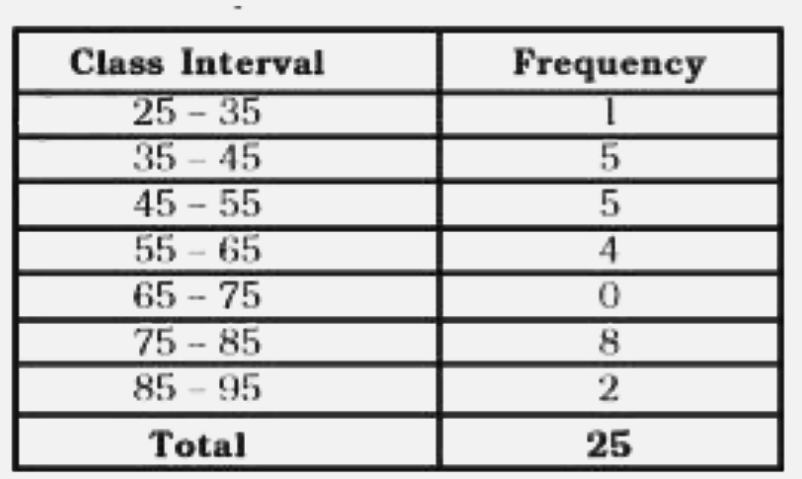
Read the frequency distribution table given below and answer the questions that follow:
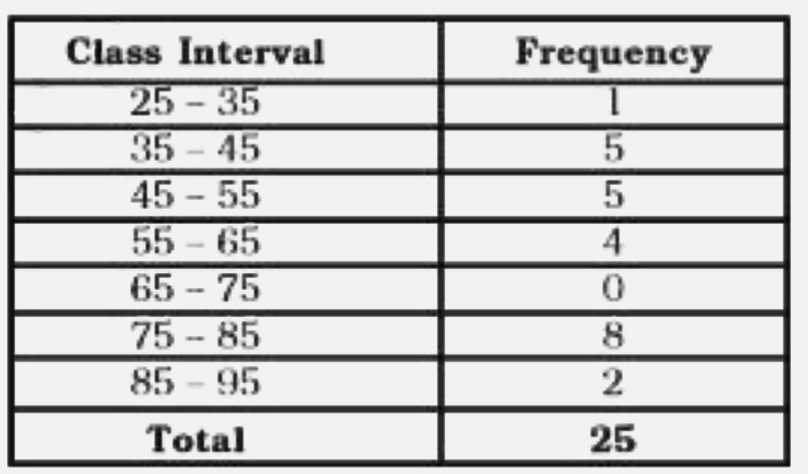
What is the upper limit of the fifth class?View SolutionRead the frequency distribution table given below and answer the questions that follow:
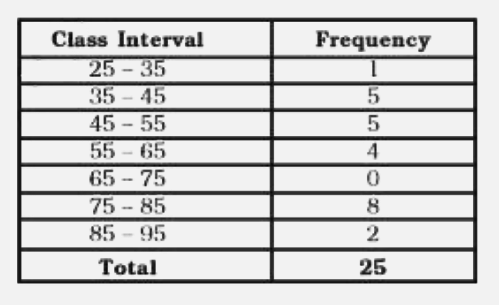
Class interval which has the highest frequency.View SolutionRead the frequency distribution table given below and answer the questions that follow:
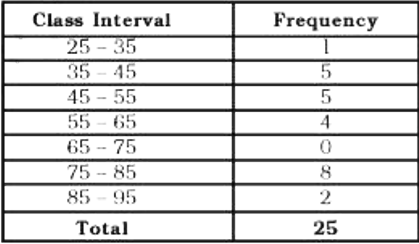
Class interval which has the lowest frequency.View SolutionStudy the given graph and answer the question that follows
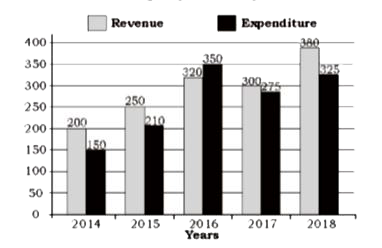
What is the ratio of the total expenditure in 2015 and 2016 to the total revenue of the company in 2016 and 2018?View SolutionRead the information given below and answer the questions that follow:
Following table gives the data on the number of students who appeared, qualified and were selected from various states in a national level exam.
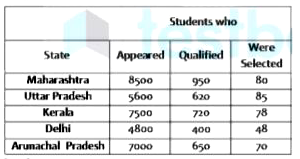
Which State has the lowest percentage of qualifications over those who had appeared?View Solution

