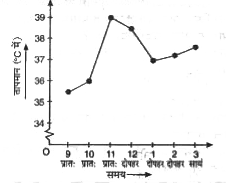
निम्न आलेख किसी अस्पताल में एक रोगी का प्रति घंटे लिया गया तापमान दर्शाता है

इस पूरे अंतराल में रोगी का तापमान दो बार एक समान ही था। ये दो समय, क्या -क्या थे ?
The correct Answer is:1 बजे दोपहर, 2 बजे दोपहर
Topper's Solved these Questions
- BOOK - MBD PUBLICATIONCHAPTER - आलेखों से परिचय EXERCISE - पाठ्य-पुस्तक प्रश्नावली 15.24videos
आलेखों से परिचय
- BOOK - MBD PUBLICATIONCHAPTER - आलेखों से परिचय EXERCISE - पाठ्य-पुस्तक प्रश्नावली 15.2 (सत्य असत्य )3videos
आलेखों से परिचय
- BOOK - MBD PUBLICATIONCHAPTER - आलेखों से परिचय EXERCISE - अतिरिक्त उदाहरण (सत्य असत्य )3videos
आलेखों से परिचय
- BOOK - MBD PUBLICATIONCHAPTER - आकड़ों का प्रबंधन EXERCISE - बहुविकल्पी प्रश्न13videos
आकड़ों का प्रबंधन
- BOOK - MBD PUBLICATIONCHAPTER - एक चार वाले रैखिक समीकरण EXERCISE - बहुविकल्पी प्रश्न15videos
एक चार वाले रैखिक समीकरण
Similar Questions
निम्न बिन्दुओ को एक वर्गकित कागज (Graph Sheet) पर अंकित कीजिये और जांचिए कि क्या वे सभी एक सरल रेखा पर स्थित है ?
A(4,0), B(4,2), C(4,6), D(4, 2.5)01:37View Solutionकोई बिंदु जिसका x निर्देशांक शून्य है तथा y- निर्देशांक शून्येतर है, y-अक्ष पर स्थित होता है।
06:07View Solutionएक बिंदु जिसका x-निर्देशांक शून्य है, y- अक्ष पर स्थित होगा।
02:11View Solutionसंकेतों का प्रयोग करते हुए आकड़ों के चित्रीय निरूपण को कहते हैं :
01:31View Solutionसमीकरण x−2=7 में x का मान है :
02:45View SolutionHow many lines of symmetry does the above figure have ?
02:17View SolutionWhich of the following are correct chain isomers of butane ? (i)
05:41View SolutionDetermine the point of symmetry of a regular hexagon.
02:21View SolutionDtermine the images of the following figure about the given line :
02:10View SolutionMatch the following Column A to Column B
 02:17View Solution
Match the following Column A to Column B
 02:10View Solution
Match the following Column A to Column B
 04:23View Solution
Find the area of the figure given below.
 01:54View Solution
The inequation represented by the graph given below is :
02:22View SolutionThe inequation that best describes the graph given below is _________
05:37View SolutionThe inequation that best describes the following graph is _________
View Solution

