A velocity–time graph is given for a particle moving in x direction, as below
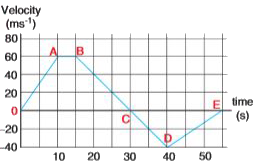
Find the distance and displacement travelled from 0 s to 40 s .
The total area under the curve from 0 s to 40 s will give the displacement. Here the area from O to C represents motion along positive x–direction and the area under the graph from C to D represents the particle.s motion along negative x–direction.
The displacement travelled by the particle from 0 s to 10 s =12×10×60=300m
The displacement travelled from 10 s to 15s=60×5=300m
The displacement travelled from 15 s to 30s=12×15×60=450m
The displacement travelled from 30s to 40 =12×10(−40)=−200m.
Here the negative sign implies that the particle travels 200 m in the negative x direction.
The total displacement from 0 s to 40 s is given by
300m+300m+450m−200m
=+850m.
Thus the particle.s net displacement is along the positive x-direction.
The total distance travelled by the particle from 0 s to 40s=300+300+450+200=1250m
Topper's Solved these Questions
- KINEMATICSBook:NCERT TAMILChapter:KINEMATICSExercise:EXERCISE (I. Multi Choice Question)
Explore 15 Videos
- KINEMATICSBook:NCERT TAMILChapter:KINEMATICSExercise:EXERCISE (IV. Exercises )
Explore 20 Videos
- HEAT AND THERMODYNAMICSBook:NCERT TAMILChapter:HEAT AND THERMODYNAMICSExercise:EVALUATION (Numerical Problems)
Explore 13 Videos
- KINETIC THEORYBook:NCERT TAMILChapter:KINETIC THEORYExercise:ADDITIONAL EXERCISE
Explore 4 Videos
Similar Questions
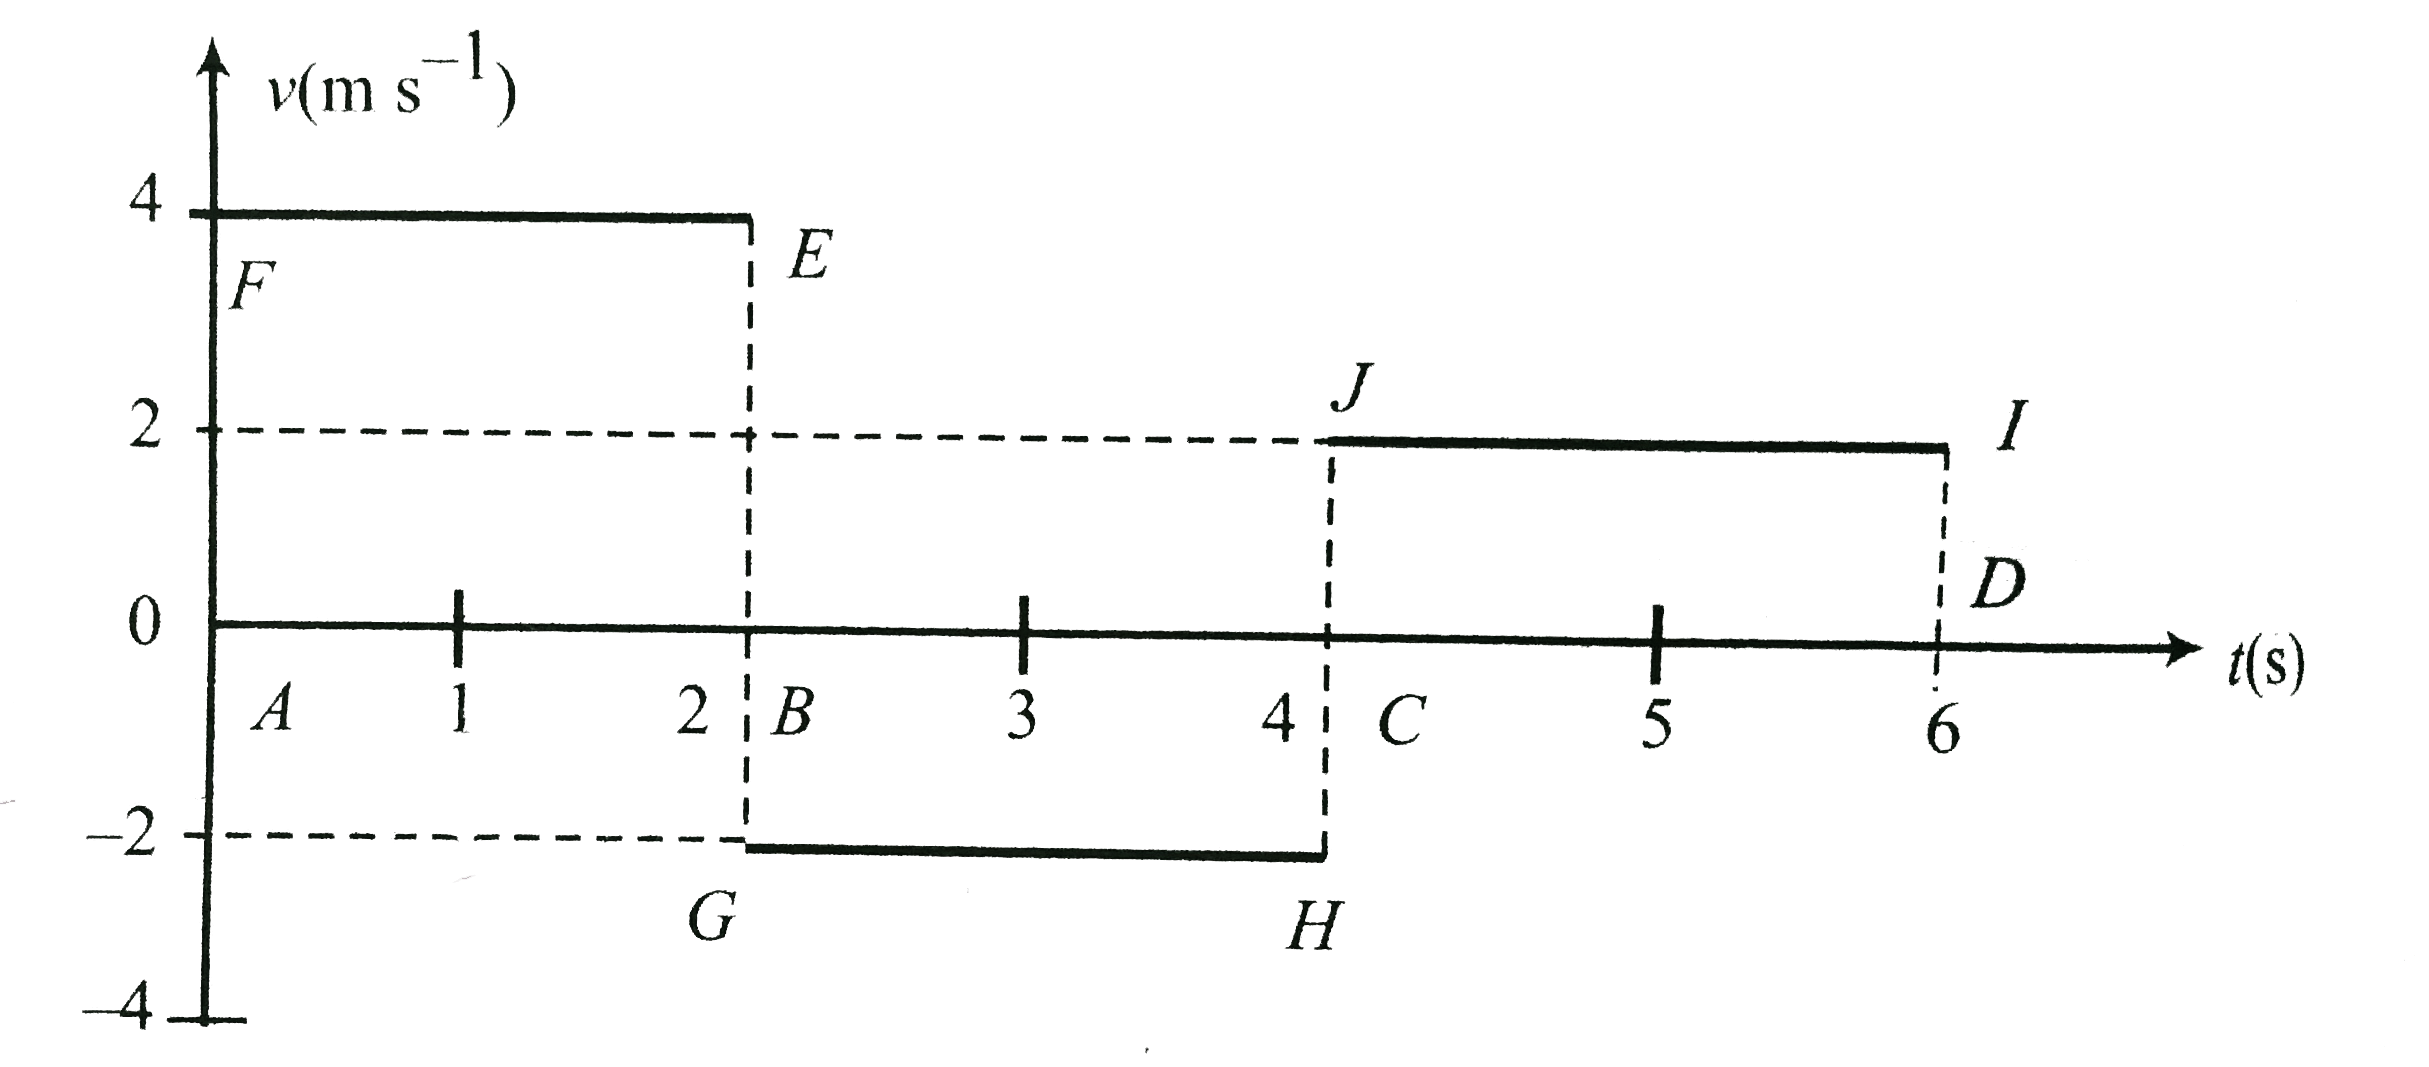
The velocity-time graph of a particle moving in a staight line is shown in the . Find the displacement and the distance trav elled by the particle in 6s.
 .
.
View SolutionThe velocity-time graph of a particle moving in a staight line is shown in the . Find the displacement and the distance trav elled by the particle in 6s.
 .
.
View Solution
Knowledge Check
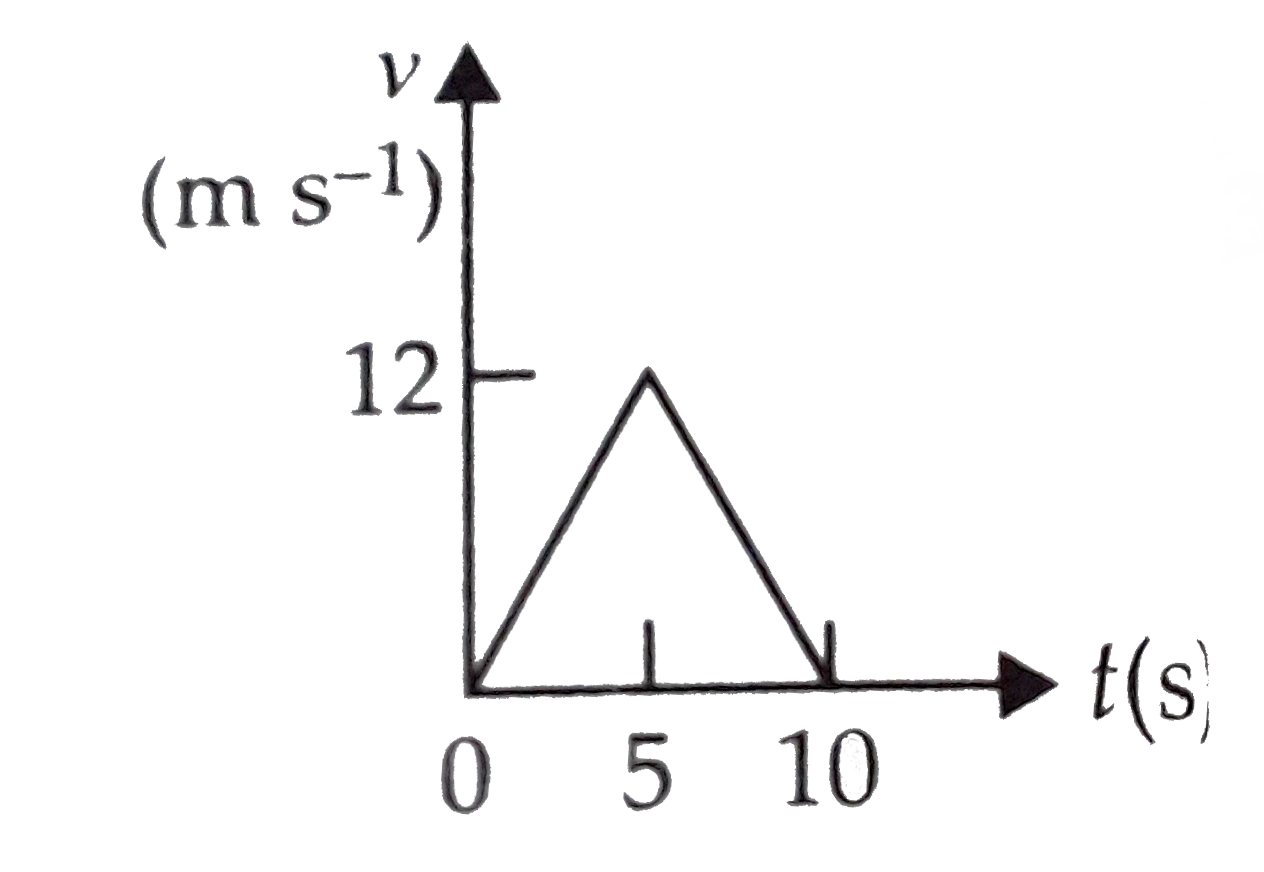
The speed-time graph of a particle moving along a fixed direction as shown in the figure. The distance traversed by the particle between t = 0 s to t = 10 s is
 A20 mB40 mC60 mD80 m
The speed-time graph of a particle moving along a fixed direction as shown in the figure. The distance travelled by the particle between t = 0 s to t = 10 s is
 A20 mB40 mC60 mD80 m
The velocity-time graph of a particle moving along a straight line is given as below. The displacement time curve for the particle is given by :
 A
A B
B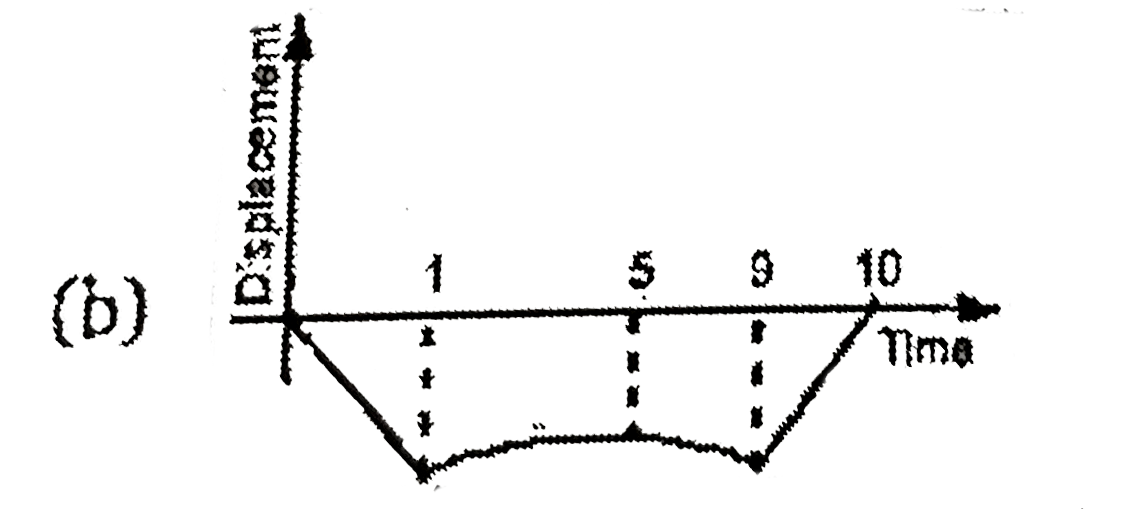 C
C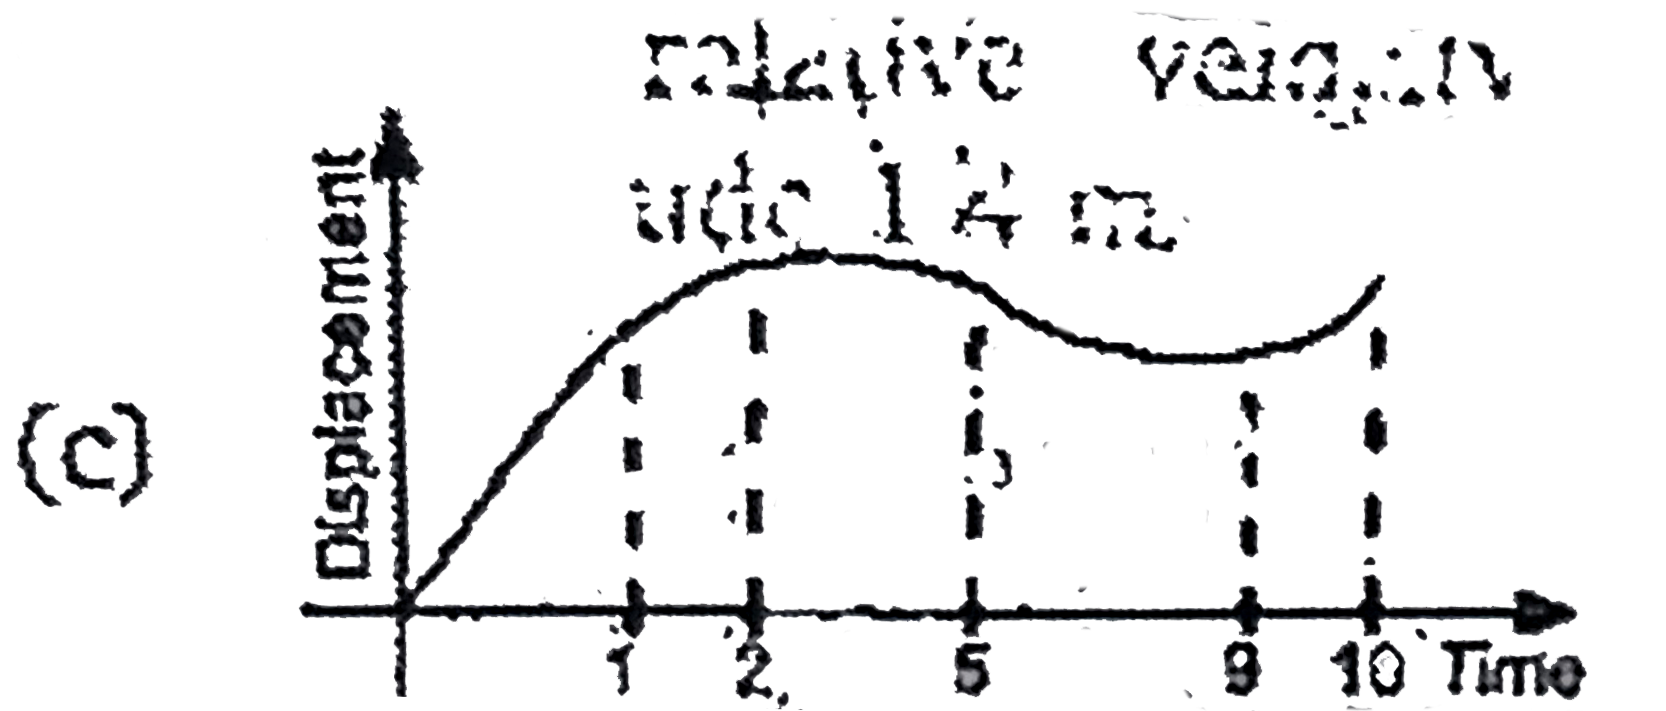 D
D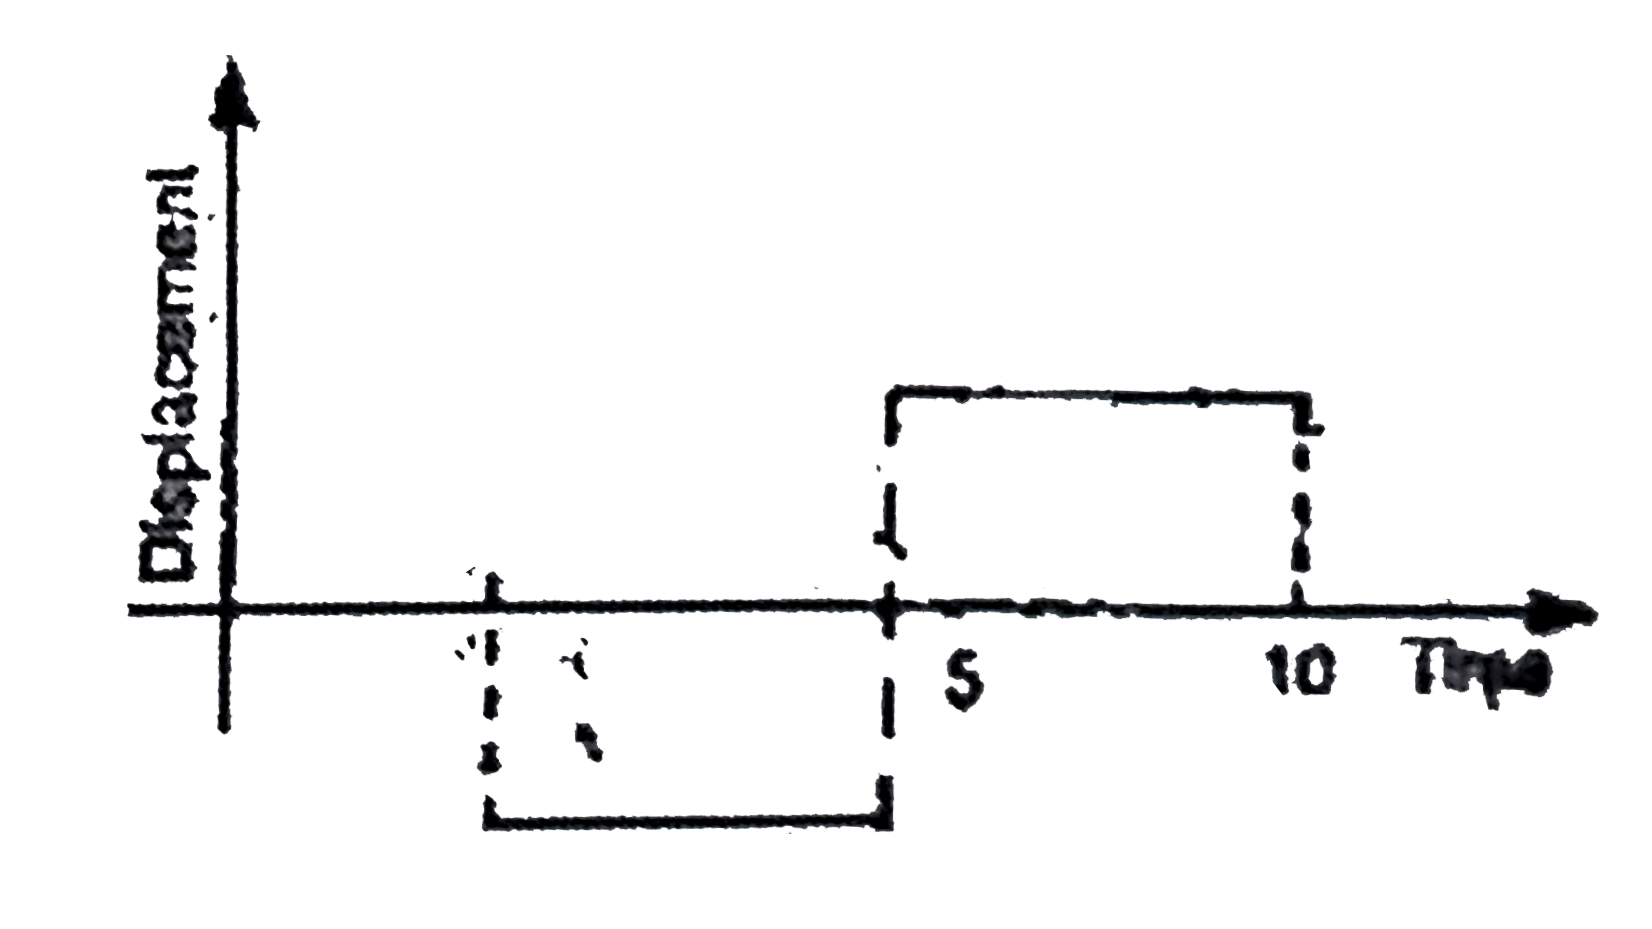
Velocity time graph for a particle moving in a line is given.
Calculate the displacement of the particle and distance travelled in first 4 seconds.
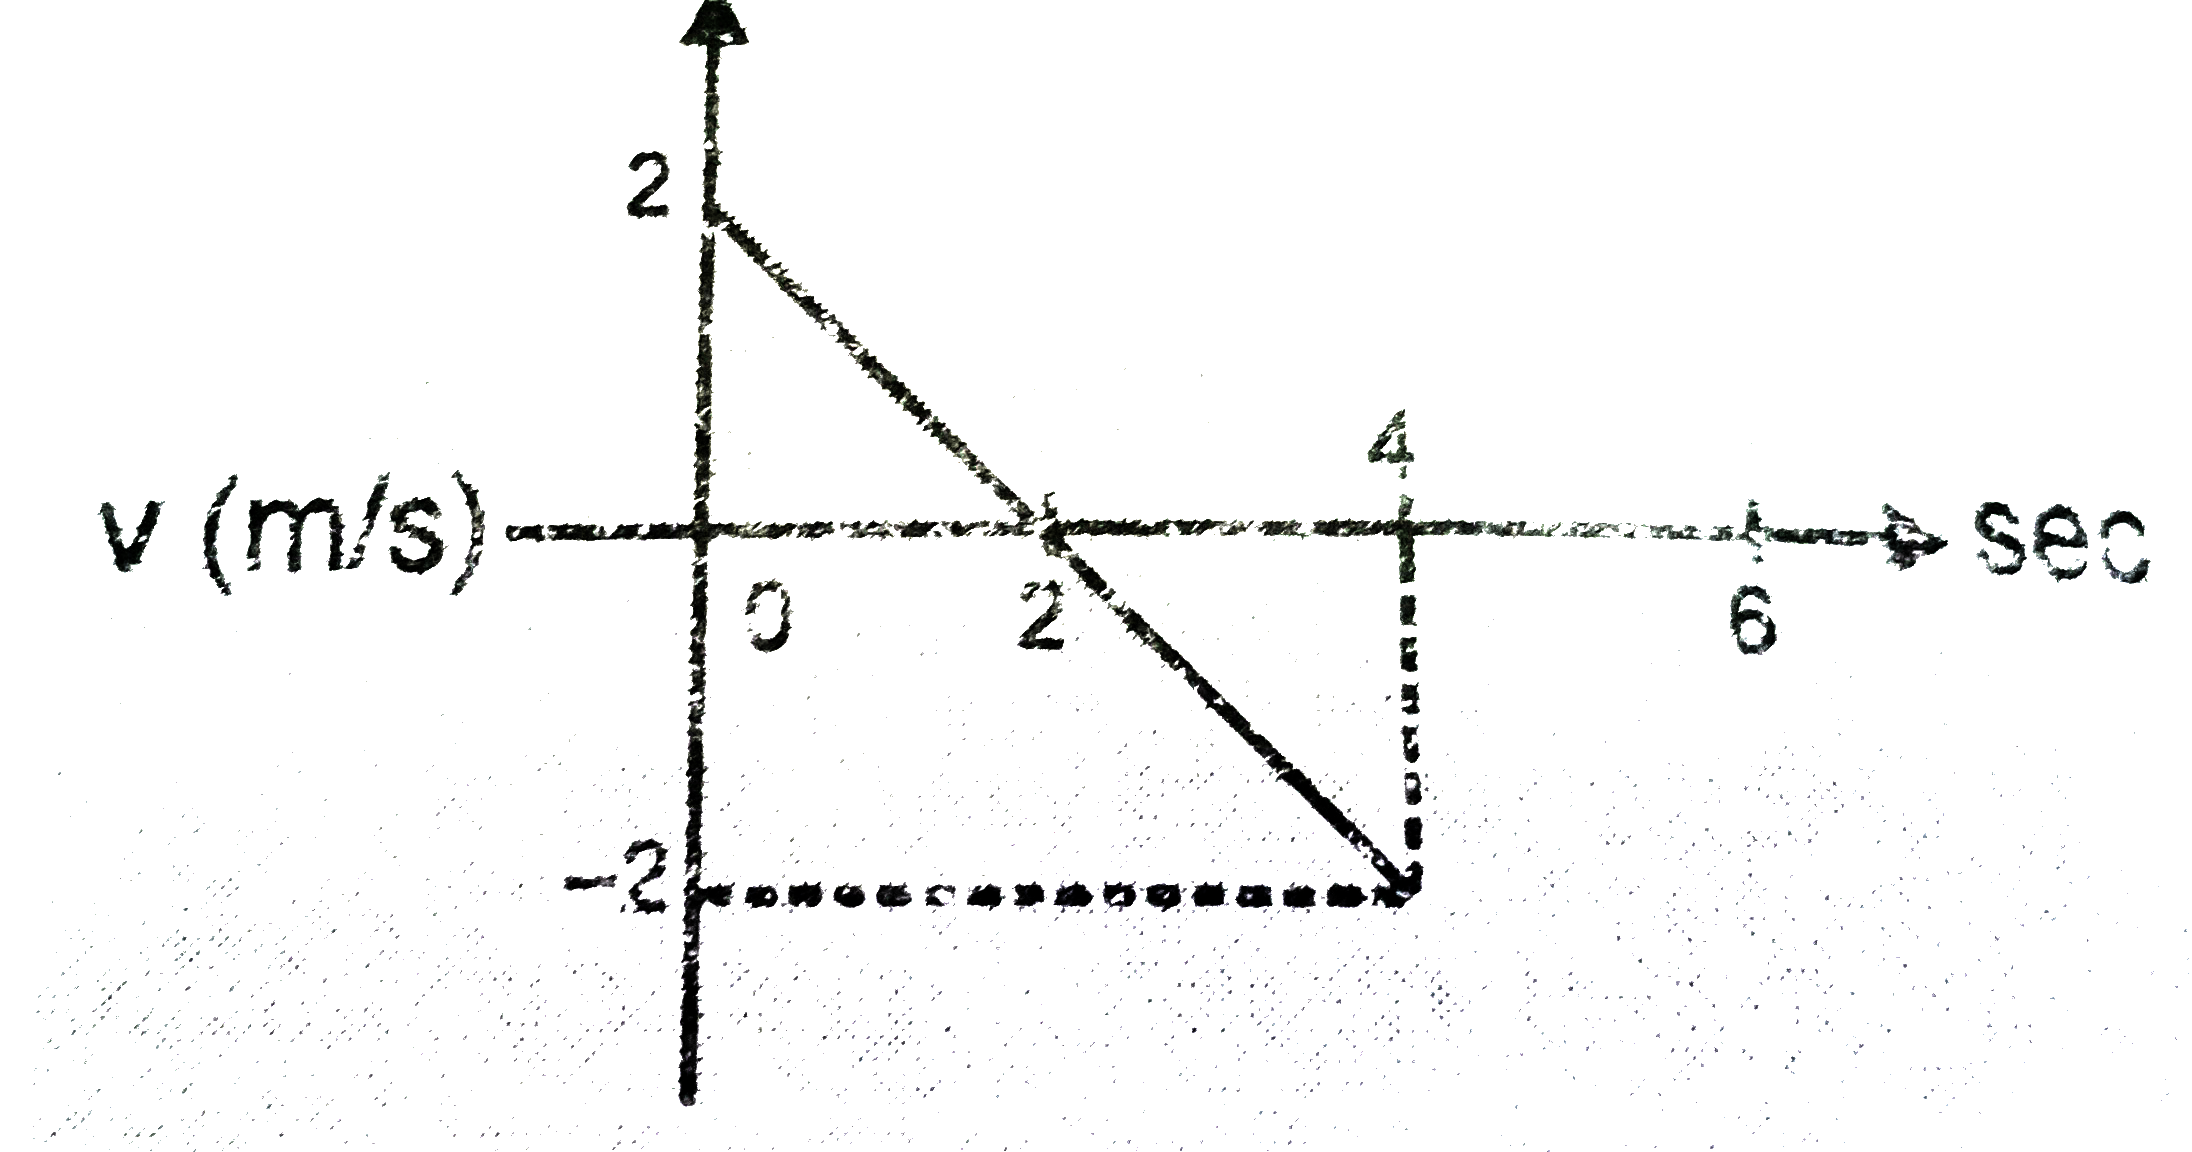
View SolutionVelocity time graph for a particle moving in a line is given.
Calculate the displacement of the particle and distance travelled in first 4 seconds.

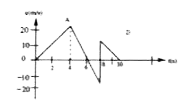
View SolutionThe velocity-time graph of a body moving in a straight line is shown in Fig. Find the displacement and distance travelled by the body in 10 sec.
View SolutionThe velocity-time graph of a particle moving along a straight line is shown in the figure-given below
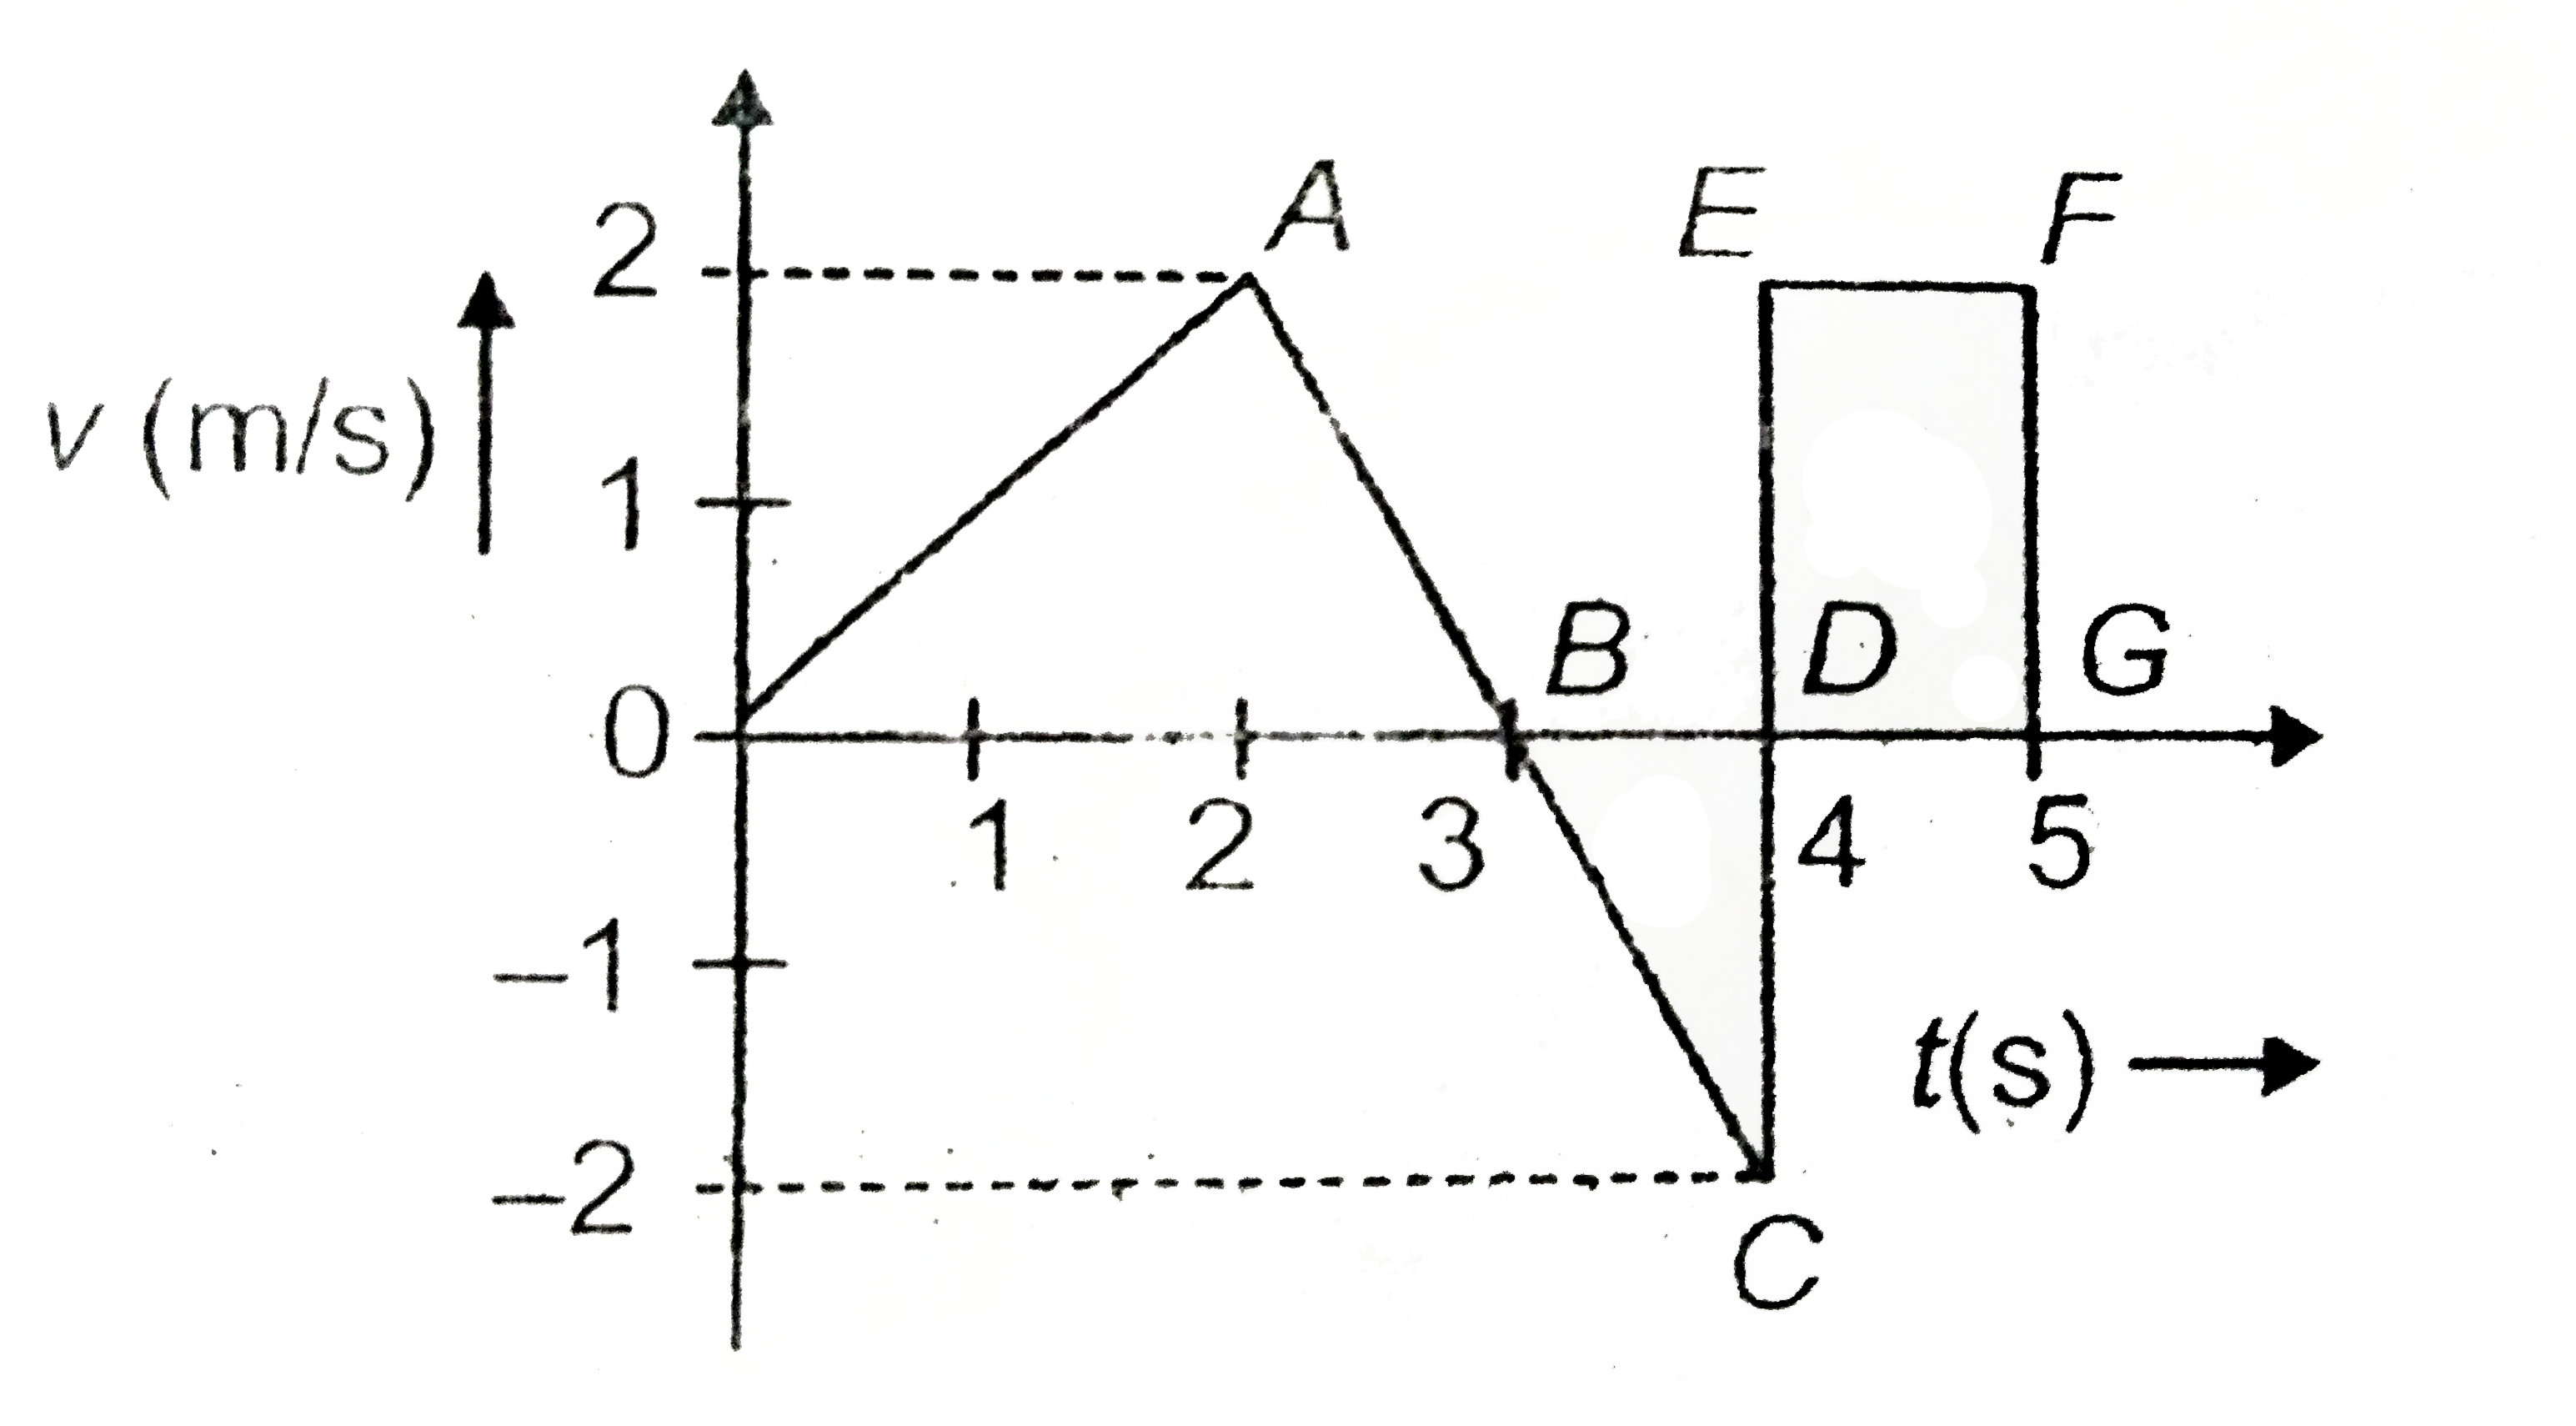
The displacement of the particle in 5 second is
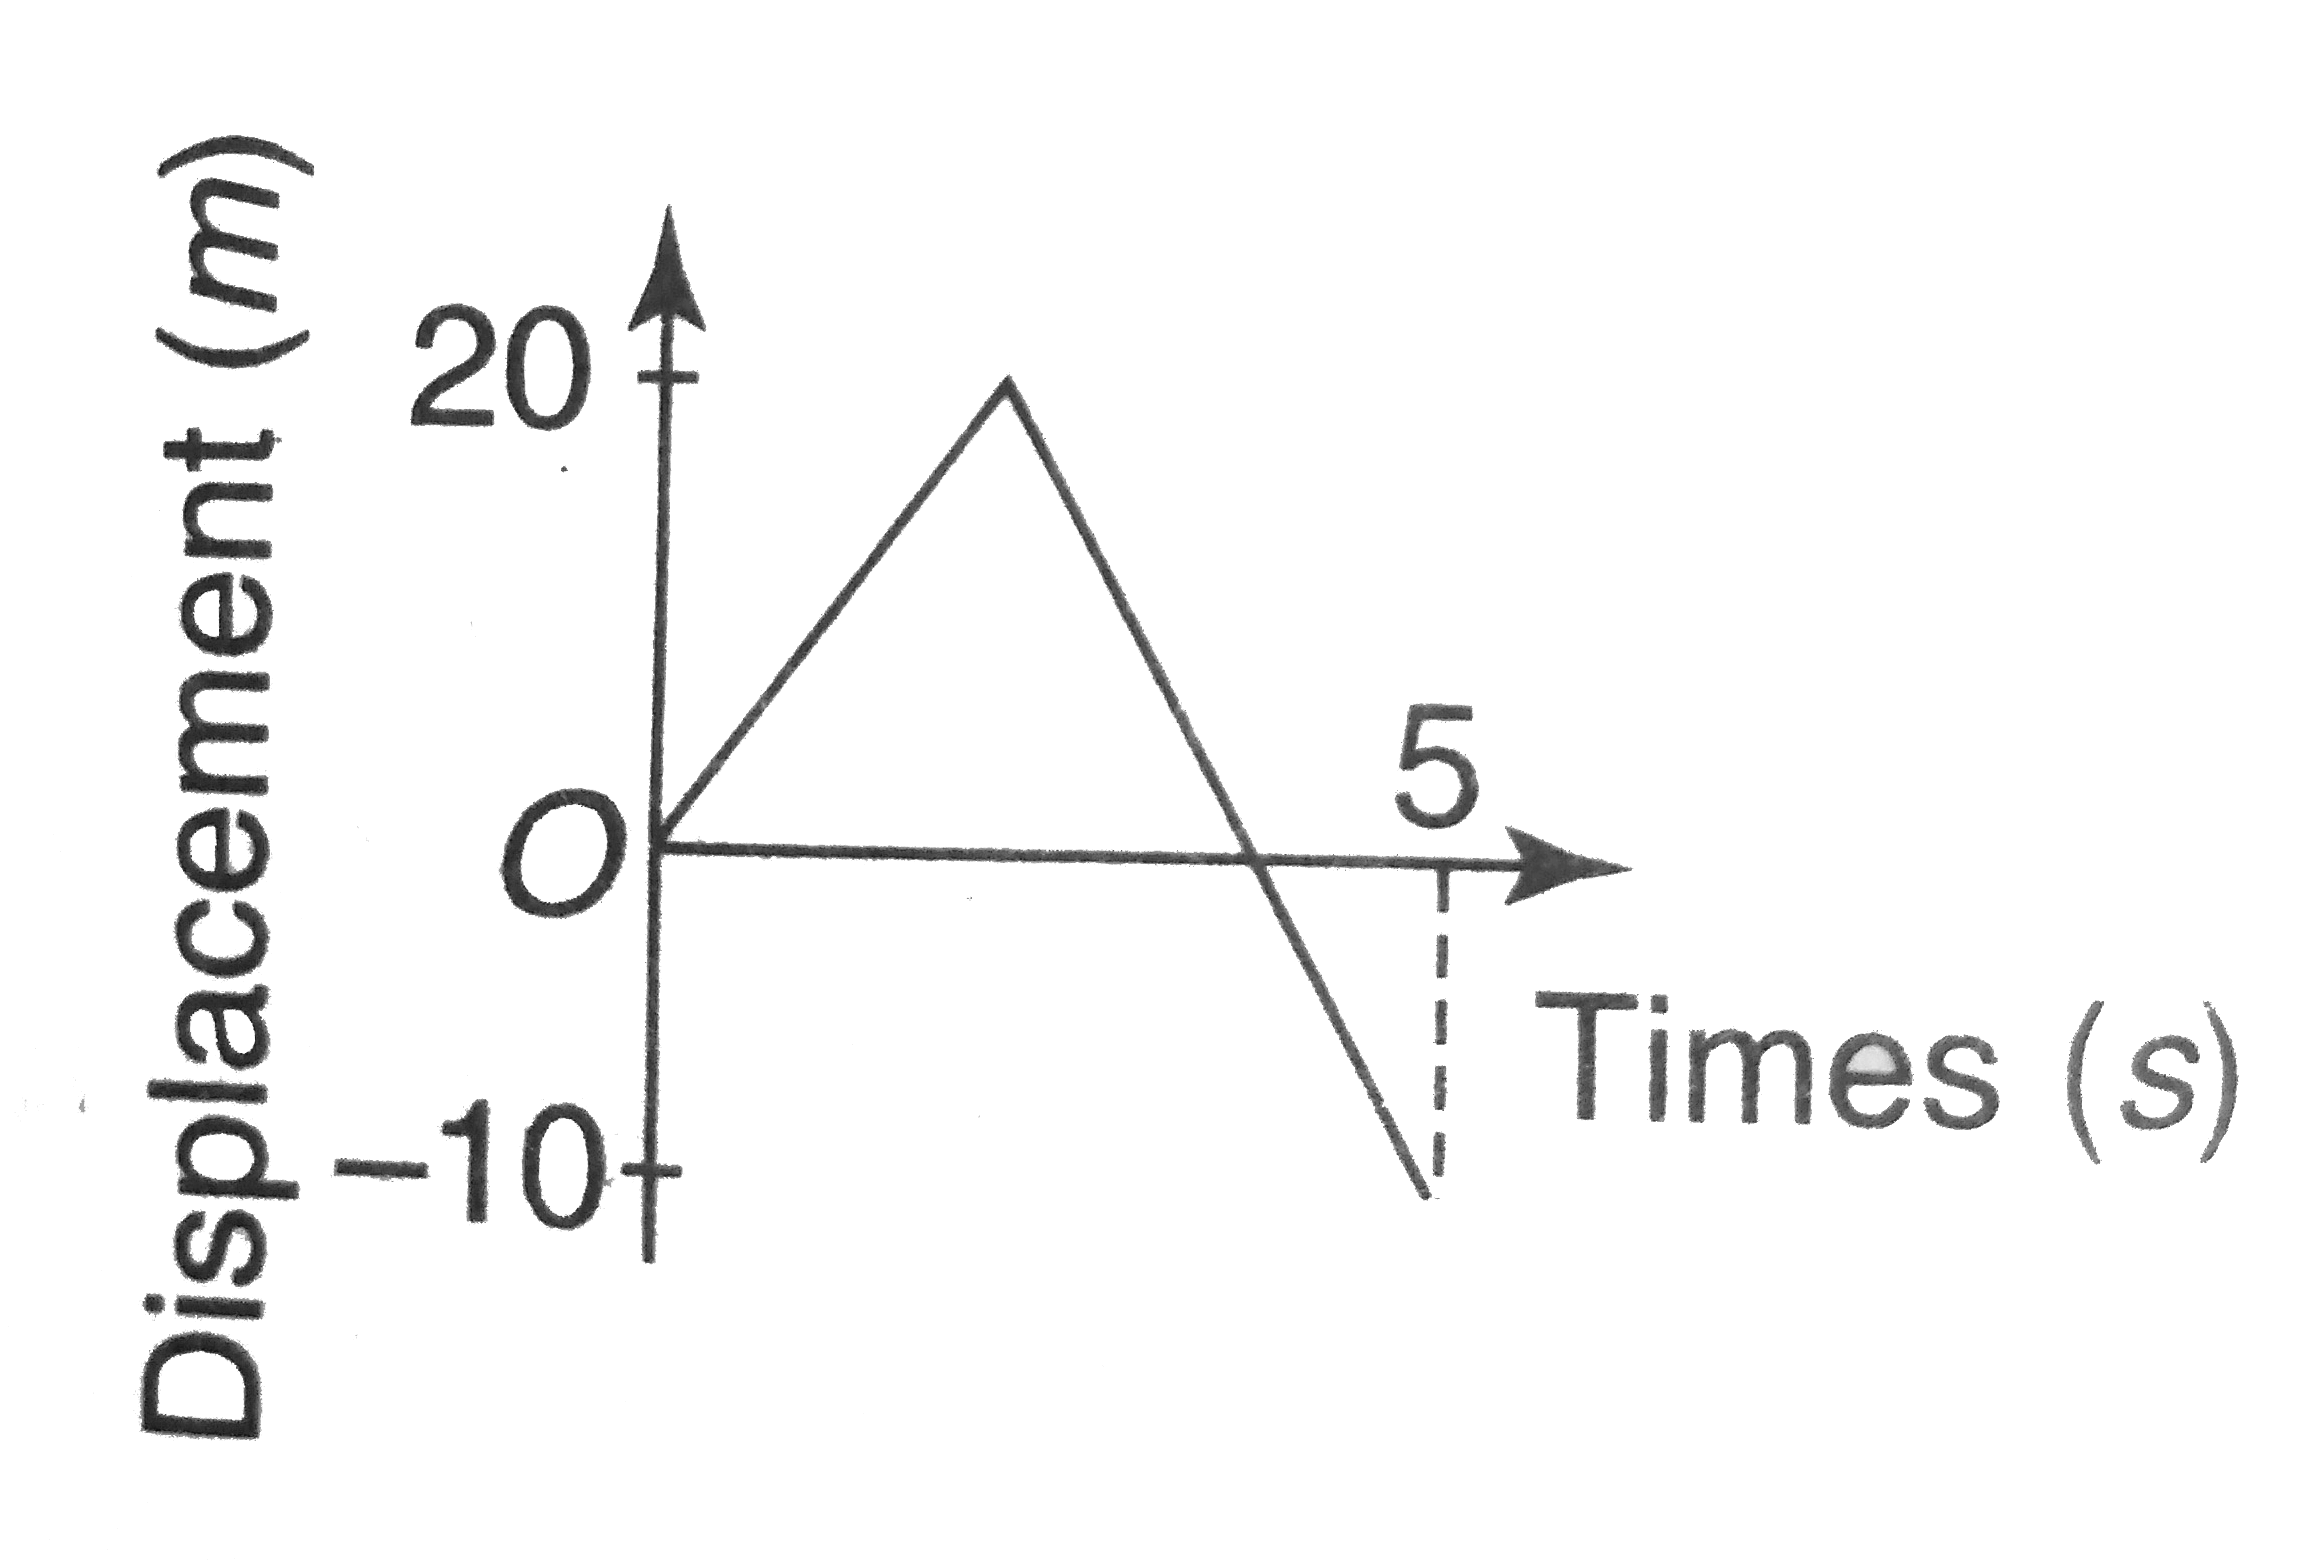
View SolutionThe diagram shows the displacement-time graph for a particle moving in a straight line. Find the average velocity for the interval from t=0 to t=5s.
View Solution
