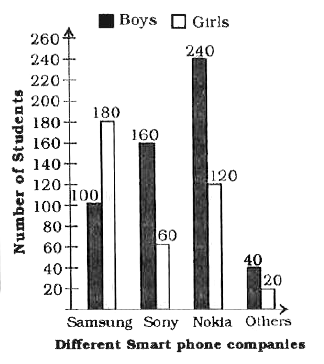
The bar chart representing the number of first year B.com students of St. Xavier's college using different companies' smart phone .study bar chart
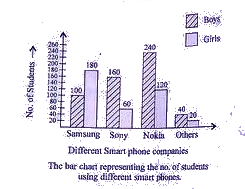
What percentage of boys are using the smart phones of Samsung?
16.52%
17.52%
18.52%
15.52%
Step by step video & image solution for The bar chart representing the number of first year B.com students of St. Xavier's college using different companies' smart phone .study bar chart What percentage of boys are using the smart phones of Samsung? by Maths experts to help you in doubts & scoring excellent marks in Class 14 exams.
Updated on:21/07/2023Similar Questions
The bar chart representing the number of first year B.com students of St. Xavier's college using different companies' smart phone .study bar chart
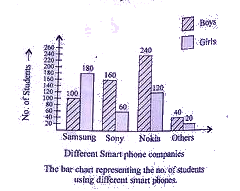
What percentage of girls are using the smart phones of Nokia ?
View SolutionThe bar chart representing the number of first year B.com students of St. Xavier's college using different companies' smart phone .study bar chart
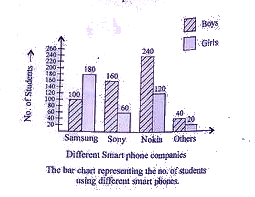
The difference between the total number of students using smart phone of "Samsung combined together and the total number of students using smart phone of Sony taken together is
View Solution
Knowledge Check
The following bar chart represents the number of first year B. Com. Students of St Xavier's College using different companies smart phones. Study bar chart and answer the questions.
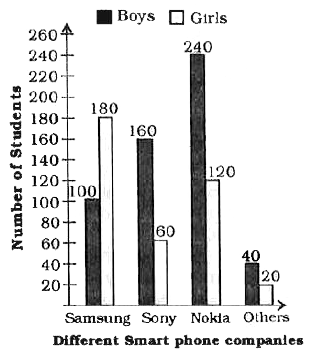
The bar chart representing the number of students using different smart phones.
What percentage of boys are using the smart phones of Samsung ?A16.52%B17.52%C18.52%D15.52%The following bar chart represents the number of first year B. Com. Students of St Xavier's College using different companies smart phones. Study bar chart and answer the questions.
The bar chart representing the number of students using different smart phones.
What percentage of girls are using the smart phones of Nokia ?A33.58%B32.58%C30.58%D31.58%The following bar chart represents the number of first year B. Com. Students of St Xavier's College using different companies smart phones. Study bar chart and answer the questions.
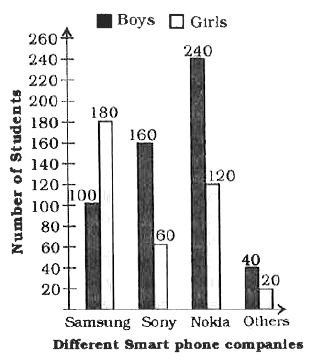
The bar chart representing the number of students using different smart phones.
The difference between the total number of students using smart phones of Samsung combined together and the total number of students using smart phones of Sony taken together isA20B60C80D40
The bar chart representing the number of first year B.com students of St. Xavier's college using different companies' smart phone .study bar chart
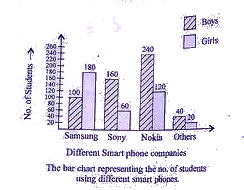
The ratio of the number of boys to the number of girls using the smart phones of Samsung and Sony together is
View SolutionThe bar-chart is showing the number of accidents in a city during the first six month of a year. Examine the bar chart and answer the following questions.
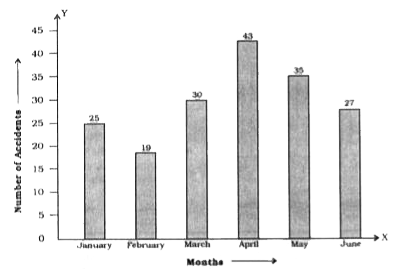
What is the percentage of accidents in the month of April to the total accidents in the city ?
View SolutionThe bar-chart is showing the number of accidents in a city during the first six month of a year. Examine the bar chart and answer the following questions.
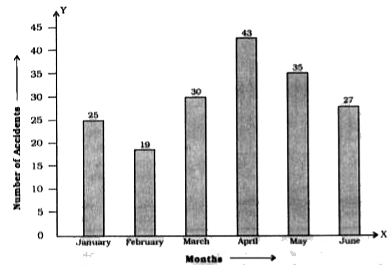
Percentage of decrease in t he number of accidents from May to June is :
View SolutionThe following bar chart represents the number of first year B. Com. Students of St Xavier's College using different companies smart phones. Study bar chart and answer the questions.
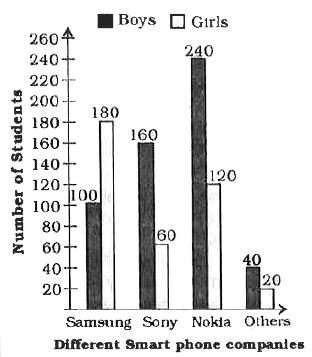
The bar chart representing the number of students using different smart phones.
The ratio of the number of boys to the number of girls usinf the smart phones of Samsung and Sony together is
View SolutionStudy the following line chart carefully and answer the questions given below it. The following line chart represents the number of employees recrulted in different years in a company.
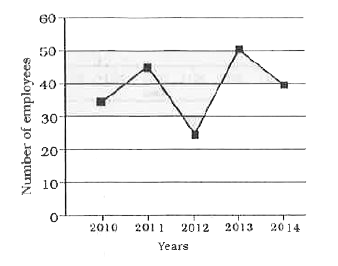
The number of employees recruited in the year 2012 was what percent of the number employees recruited in the year 2014 ?
View Solution
