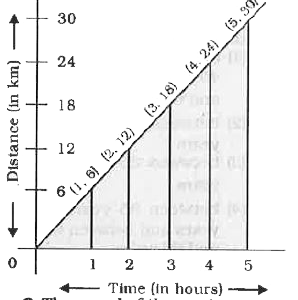
According to the given speed- time (v-t) graph, what happens to the distance covered by the car from 0-10 minutes?

It goes on increasing.
It goes on decreasing.
It first increases and then decreases.
It first decreases and then increases.
The correct Answer is:A
As distance is always positive in nature. Hence it always increases wherever object moves.
Topper's Solved these Questions
Similar Questions
Knowledge Check
A car moves with a speed of 40 km/h for 15 minutes and then with a speed of 60 km/h for the next 15 minutes. The total distance covered by the car is:
A100kmB25kmC15kmD10kmA car moves with a speed of 40 km/h for 15 minutes and then with a speed of 60 km/h for the next 15 minutes. The total distance covered by the car is:
A100 kmB25 kmC15 kmD10 kmThe graph given here shows a car following the linear path with uniform speed. Study the graph and answer the questions.

The speed of the car (in metres per minute) isA60B100C600D1000
A particle moves according to the law, x=acos(πt/2). . What is the distance covered by it in time interval t=0 to t=3 second.
View SolutionA car starts from rest and accelerates uniformly to a speed of 180kmh−1 in 10 s. The distance covered by the car in the time interval is
View Solution09A body moving in a straight line covers half the distance with a speed V the remaining part of the distance was covered with a speed V for half the time and with a speed V for the other half of the time.What is the average speed of the body?
View SolutionA car starts from rest and accelerates uniformly to a speed of 180kmh−1 in 10 s. The distance covered by the car in the time interval is
View SolutionA bus covers a 60 kilometre distance in 1 hour 30 minutes, whereas the same distance is covered by a car in 45 minutes. What is the ratio of the speed of the car to the speed of the bus?
View Solution

