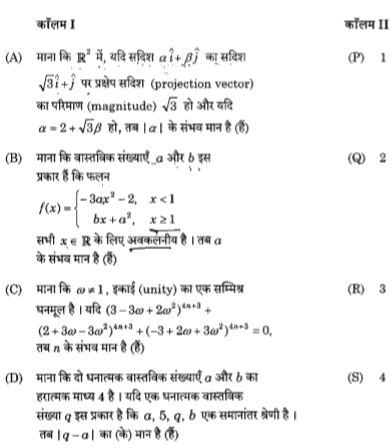
कॉलम 'I ' को कॉलम 'ii' के साथ मिलाकर सही जोड़े बनाइए
Step by step video & image solution for कॉलम 'I ' को कॉलम 'ii' के साथ मिलाकर सही जोड़े बनाइए by Maths experts to help you in doubts & scoring excellent marks in Class 12 exams.
Topper's Solved these Questions
- BOOK - JEE Main & Advanced (Hindi Medium)CHAPTER - JEE ADVANCED पेपर - 1 (2015)EXERCISE - भाग III : गणित (खंड - 2)10videos
JEE ADVANCED पेपर - 1 (2015)
- BOOK - JEE Main & Advanced (Hindi Medium)CHAPTER - JEE ADVANCED पेपर - 1 (2014)EXERCISE - PART III : MATHEMATICS (खण्ड - 2 : (एक पूर्णांक मान सही प्रकार))10videos
JEE ADVANCED पेपर - 1 (2014)
- BOOK - JEE Main & Advanced (Hindi Medium)CHAPTER - JEE ADVANCED पेपर - 1 (2016)EXERCISE - भाग III : गणित (खंड 3)5videos
JEE ADVANCED पेपर - 1 (2016)
Similar Questions
माना कि X एवं Y दो स्वेच्छ , 3×3 , शून्येतर (non - zero) विषम सममित (skew - symmetric) आव्यूह (Matrix) है और Z एक स्वेच्छ, 3×3 शून्येतर, सममित (symmetric) आव्यूह है। तब निम्नलिखित में से कौन-सा (से) विषम सममित आव्यूह है (हैं) -
01:37View Solutionवक्र (y−x5)2=x(1+x2)2 के बिन्दु (1,2) पर स्पर्श रेखा की प्रवणता है
06:07View Solutionमाना m ऐसा न्यूनतम धनात्मक पूर्णांक है की (1+x)2+(1+x)3+........+(1+x)49+(1+xm)50 के विस्तार में x2 का गुणांक (3n+1)51C3 किसी धनात्मक पूर्णांक n के लिए तब, n का मान है
02:11View SolutionHow many lines of symmetry does the above figure have ?
01:31View SolutionWhich of the following are correct chain isomers of butane ? (i)
02:45View SolutionDetermine the point of symmetry of a regular hexagon.
02:17View SolutionDtermine the images of the following figure about the given line :
05:41View SolutionMatch the following Column A to Column B
 02:21View Solution
Match the following Column A to Column B
 02:03View Solution
Match the following Column A to Column B
 02:10View Solution
Find the area of the figure given below.
 02:17View Solution
The area of the shaded part in the figure given below is ______.
 02:10View Solution
The inequation represented by the graph given below is :
04:23View SolutionThe inequation that best describes the graph given below is _________
03:12View SolutionThe inequation that best describes the following graph is _________
04:00View SolutionWhich inequations represent the shaded region in the given figure
05:46View Solution

