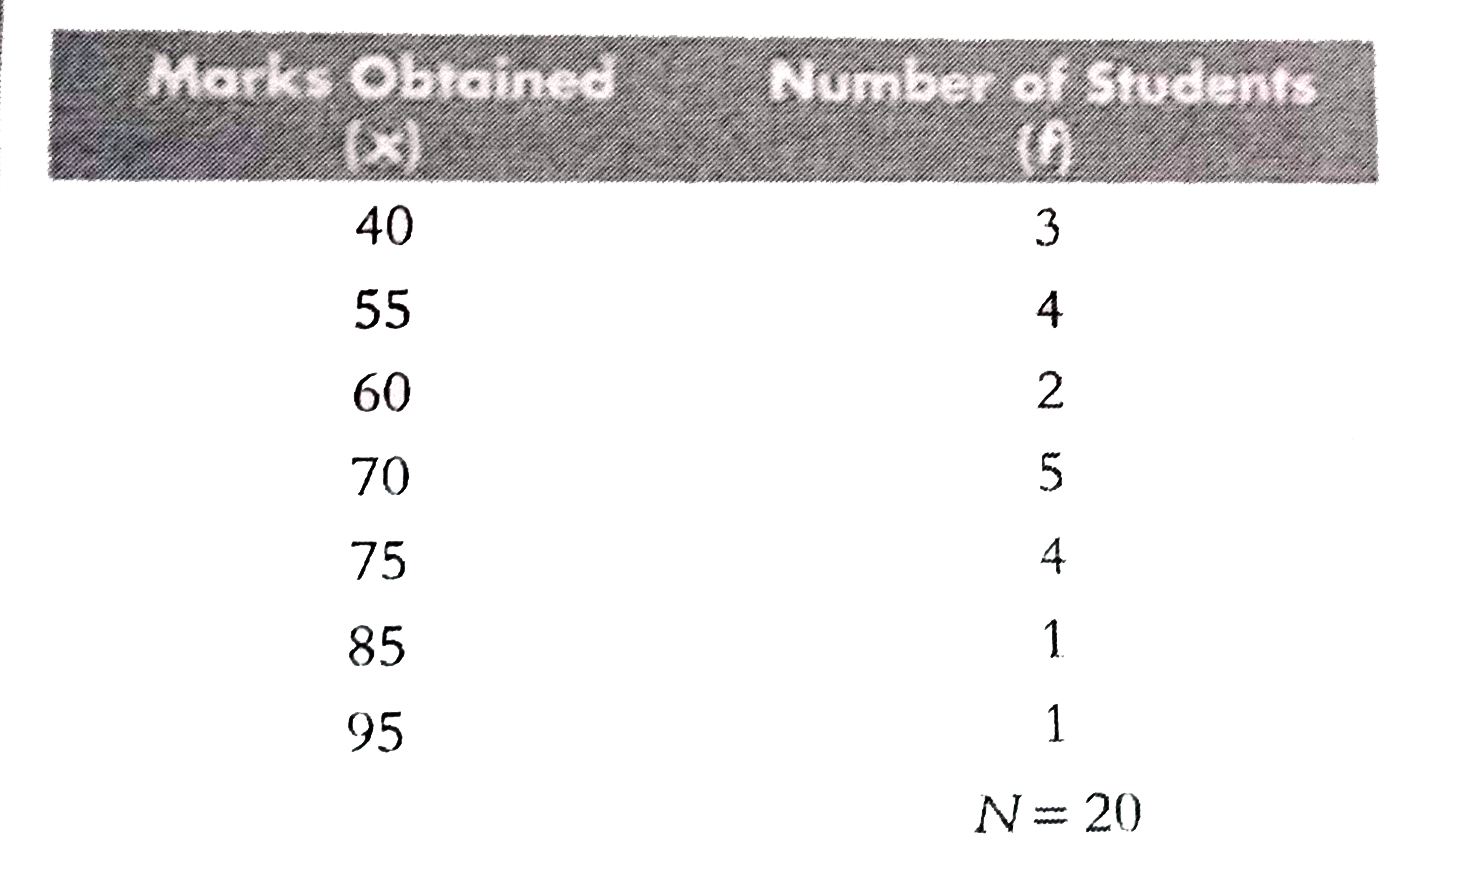
Mrs Garg recorded the marks obtained by her students in the following table. She calculated the modal marks of the students of the class as 45. While printing the data, a blank was left. Find the missing frequency in the table given below

The correct Answer is:12
Topper's Solved these Questions
- SAMPLE QUESTION PAPERBOOK - OSWAL PUBLICATIONCHAPTER - SAMPLE QUESTION PAPEREXERCISE - Section - B
5 Videos
- SAMPLE QUESTION PAPERBOOK - OSWAL PUBLICATIONCHAPTER - SAMPLE QUESTION PAPEREXERCISE - Section -C
5 Videos
- SAMPLE QUESTION PAPERBOOK - OSWAL PUBLICATIONCHAPTER - SAMPLE QUESTION PAPEREXERCISE - Section -C
5 Videos
- SAMPLE PAPER 7BOOK - OSWAL PUBLICATIONCHAPTER - SAMPLE PAPER 7EXERCISE - Section -C
7 Videos
- SOME APPLICATIONS OF TRIGONOMETRY (HEIGHTS AND DISTANCES) BOOK - OSWAL PUBLICATIONCHAPTER - SOME APPLICATIONS OF TRIGONOMETRY (HEIGHTS AND DISTANCES) EXERCISE - CASE-BASED MCQs
15 Videos
Similar Questions
The following table shows the marks obtained by 100 students of a class in a school during a particular academic session. Find the modal marks.

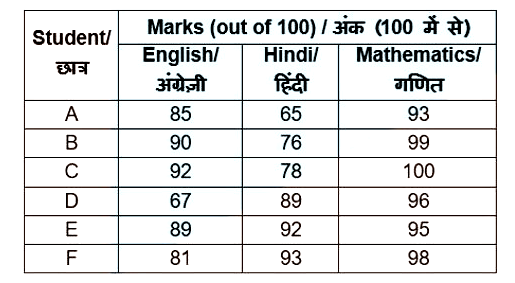
View SolutionThe table given below shows the marks obtained by 6 students in 3 subjects.

What are the average marks per students in Mathematics?
View Solution
Knowledge Check
_2019_CBT6_E01_019_Q01.png)
The marks of 20 students in an examination are given in the following table. Average marks of these student is:A2.6B2.7C2.8D2.9The marks (maximum marks 100) obtained by 20 students in a test are given below :

Find the mean marks of the 20 students.A64B64.5C54D54.5The table shows the marks obtained by 25 students in a class test. Find the mean of the marks obtained
 A7.72B7.65C7.4D7
The table shows the marks obtained by 25 students in a class test. Find the mean of the marks obtained

View SolutionGiven below are the marks obtained by the students of a class. Calculate mean deviation, and its coefficient, median of data:

View SolutionThe given table shows the marks obtained by 80 students in a class test with maximum marks 100. A student of the class is selected at random. Find the probability that he gets less than 15% marks.
View SolutionThe following table shows frequency distribution of marks of 100 students of 10th class which they obtianed in a practice examination. Find the median of the marks.

View SolutionThe given table shows the marks obtained by 80 students in a class test with maximum marks 100.

A student of the class is selected at random. Find the probability that he/she gets less than 15% marks.
View Solution
