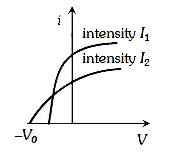
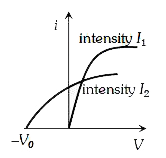
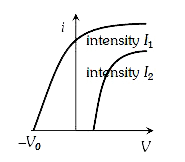
The curve (a),(b) (c) and (d) show the variation between the applied potential difference (V) and the photoelectric current (i), at two different intensities of light (I1>I2). In which figure is the correct variation shown?

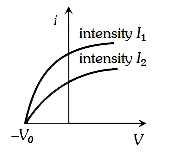
The correct Answer is:B
V0 does not depend on intensity and current ∝ intensity ,
∴i1>i2
Topper's Solved these Questions
- BOOK - ERRORLESSCHAPTER - ELECTRON, PHOTON, PHOTOELECTRIC EFFECT & X -RAYEXERCISE - NCERT BASED QUESTIONS (X-Rays)34videos
ELECTRON, PHOTON, PHOTOELECTRIC EFFECT & X -RAY
- BOOK - ERRORLESSCHAPTER - ELECTRON, PHOTON, PHOTOELECTRIC EFFECT & X -RAYEXERCISE - PAST YEARS QUESTIONS71videos
ELECTRON, PHOTON, PHOTOELECTRIC EFFECT & X -RAY
- BOOK - ERRORLESSCHAPTER - ELECTRON, PHOTON, PHOTOELECTRIC EFFECT & X -RAYEXERCISE - NCERT BASED QUESTIONS (Matter Waves)24videos
ELECTRON, PHOTON, PHOTOELECTRIC EFFECT & X -RAY
- BOOK - ERRORLESSCHAPTER - ELECTROMAGNETIC INDUCTIONEXERCISE - ASSERTION & REASON20videos
ELECTROMAGNETIC INDUCTION
- BOOK - ERRORLESSCHAPTER - ELECTRONICSEXERCISE - Assertion & Reason26videos
ELECTRONICS
Similar Questions
Knowledge Check
- Question 1 - Select One
The curves (a),(b),(c) and (d) show the variation between the applied potential difference (V) and the photoelectric current (i) , at two different intensities of light (I1>I2). In which figure is the correct variation shown ?
A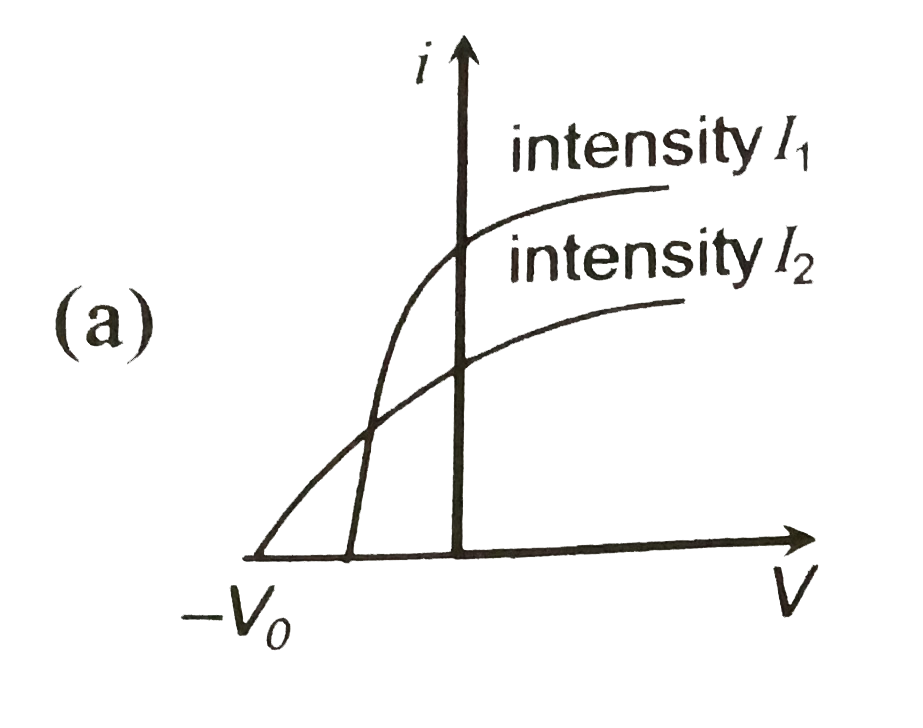 B
B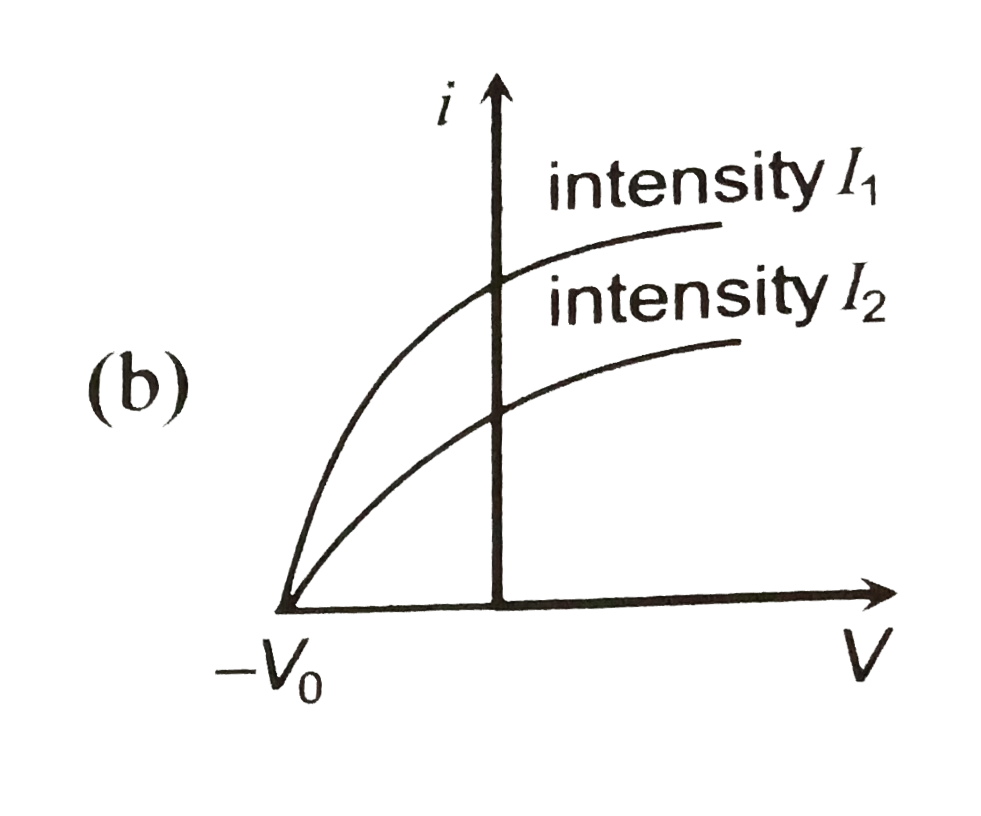 C
C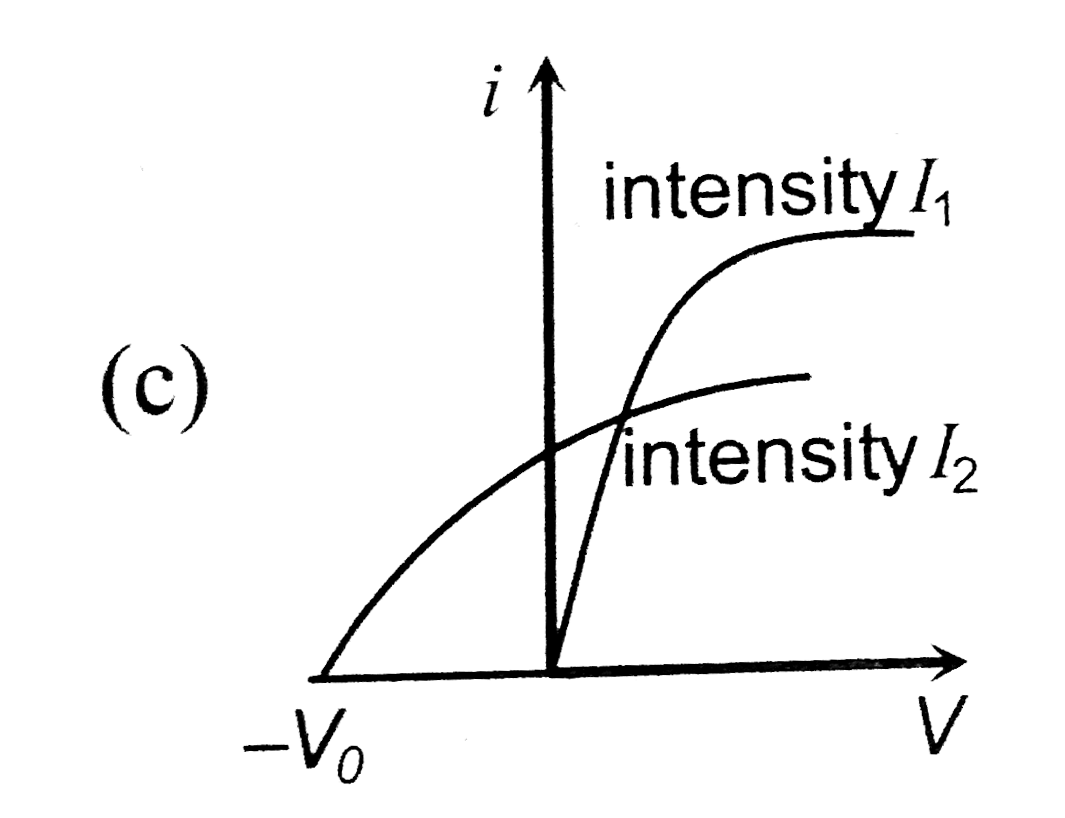 D
D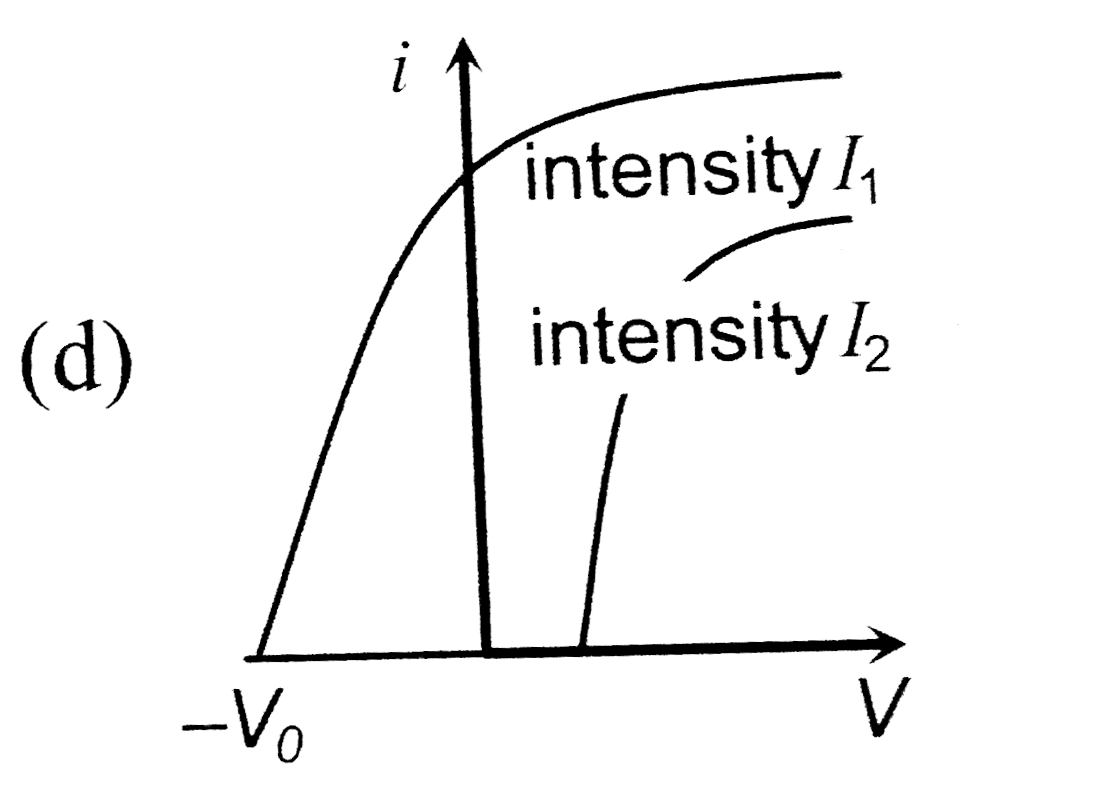
- Question 2 - Select One
The curve between current (i) and potential difference (V) for a photo cell will be
A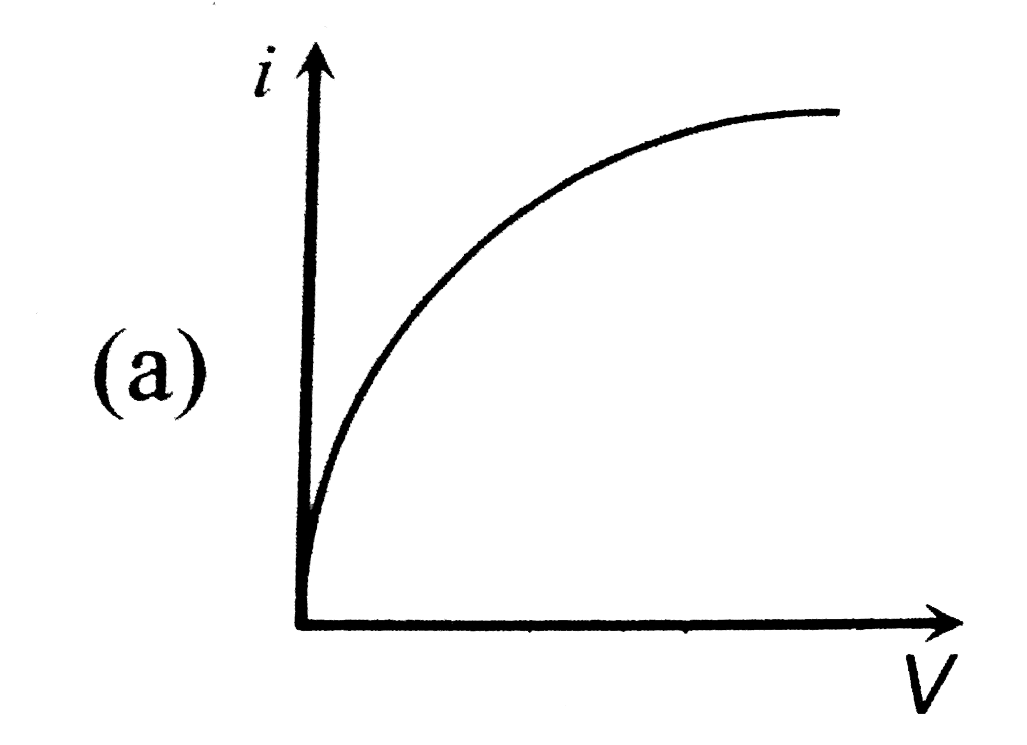 B
B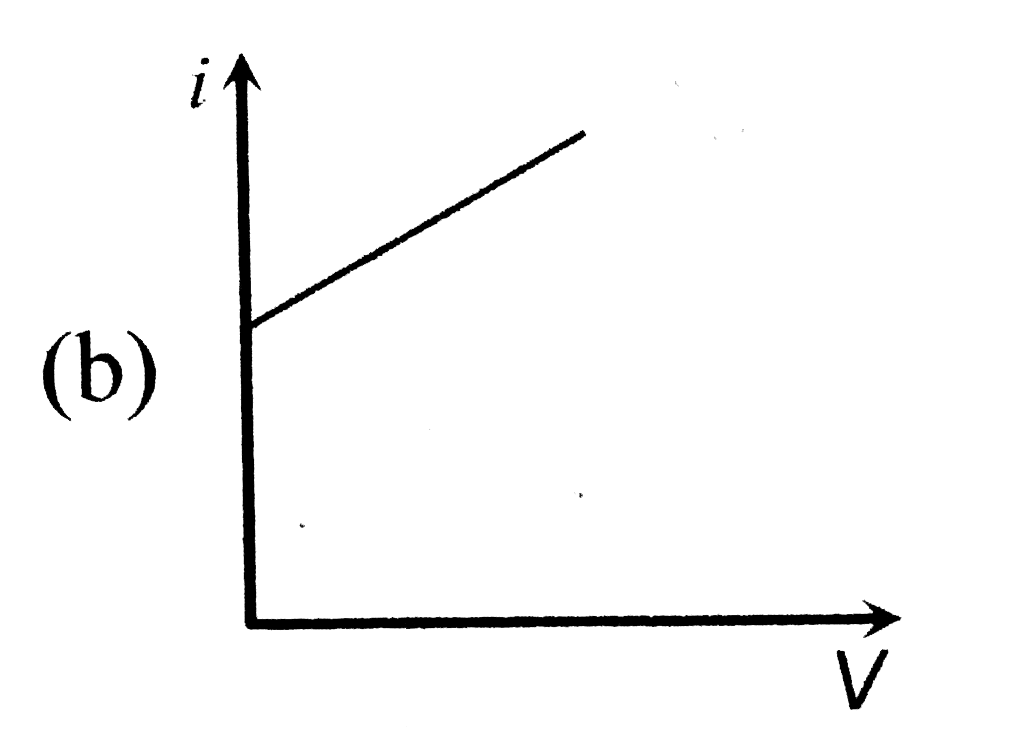 C
C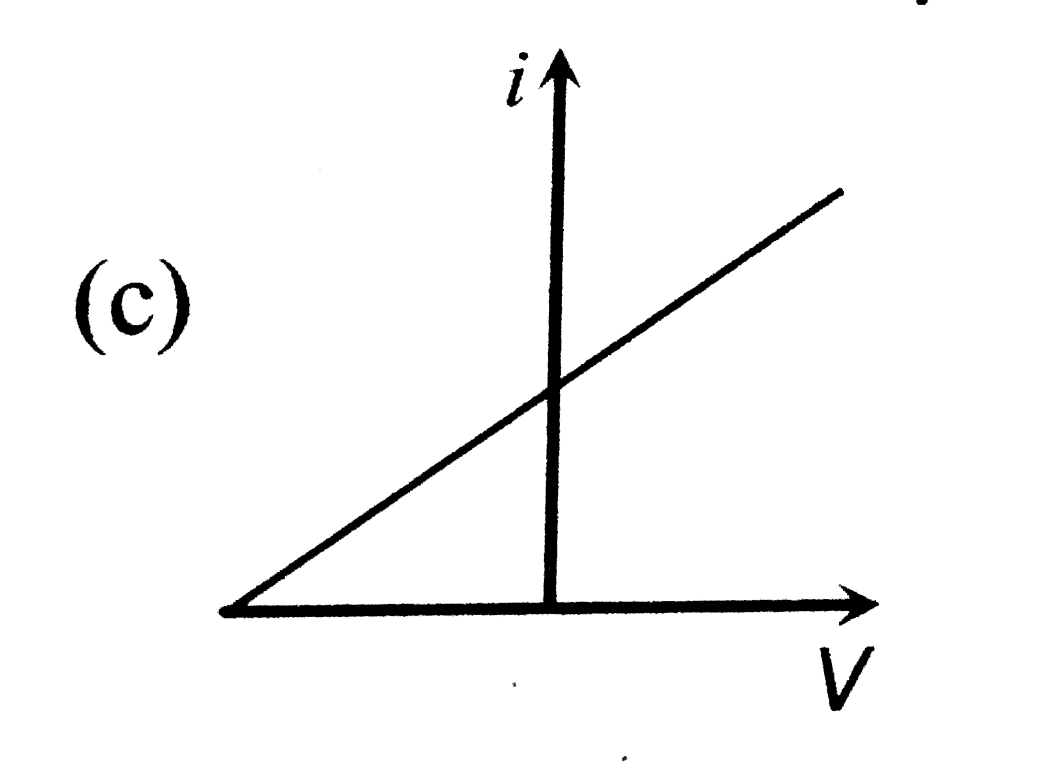 D
D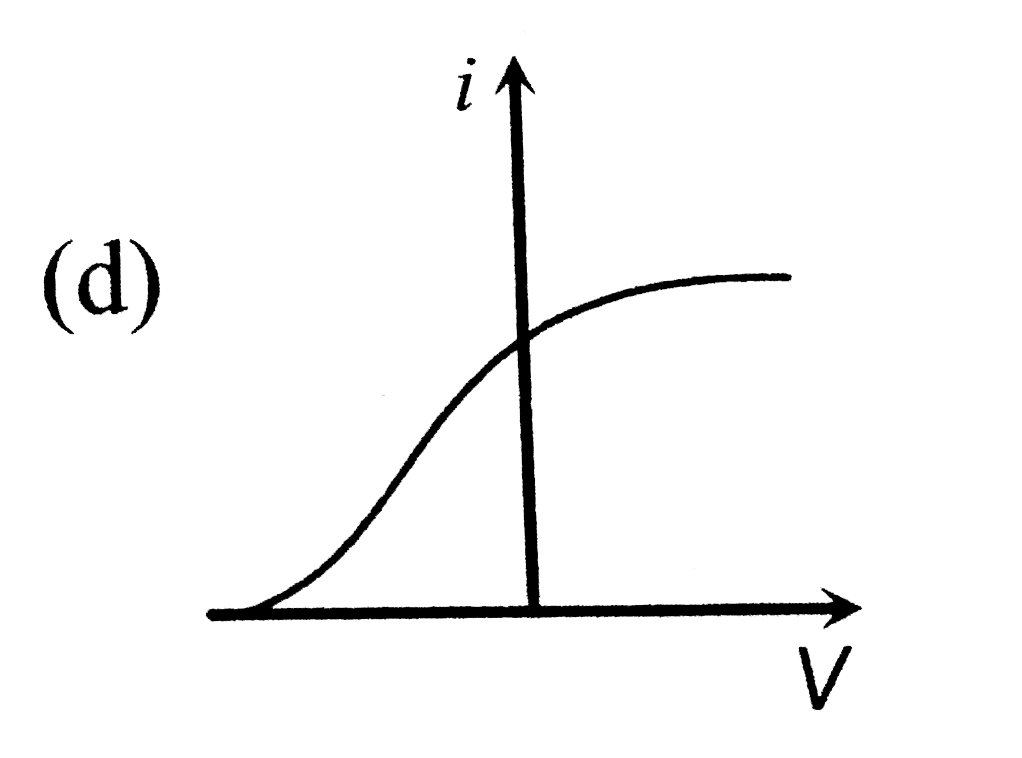
- Question 3 - Select One
For a metallic wire, the ratio Vi(V=applied potential difference and i= current flowing)is
Aindependent of temperatureBincreases as the temperature risesCdecreases as the temperature risesDincreases or decreases as temperature rises depending upon the metal
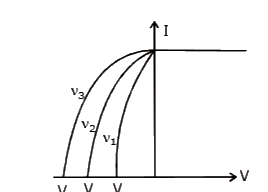
Photoelectric current as a function of voltage V for different light frequencies is shown here. Then the correct relation is
 View Solution
The relation between potential difference (V) and current (I) was discovered by:
A) Pascal
B) Tesla
C) Newton
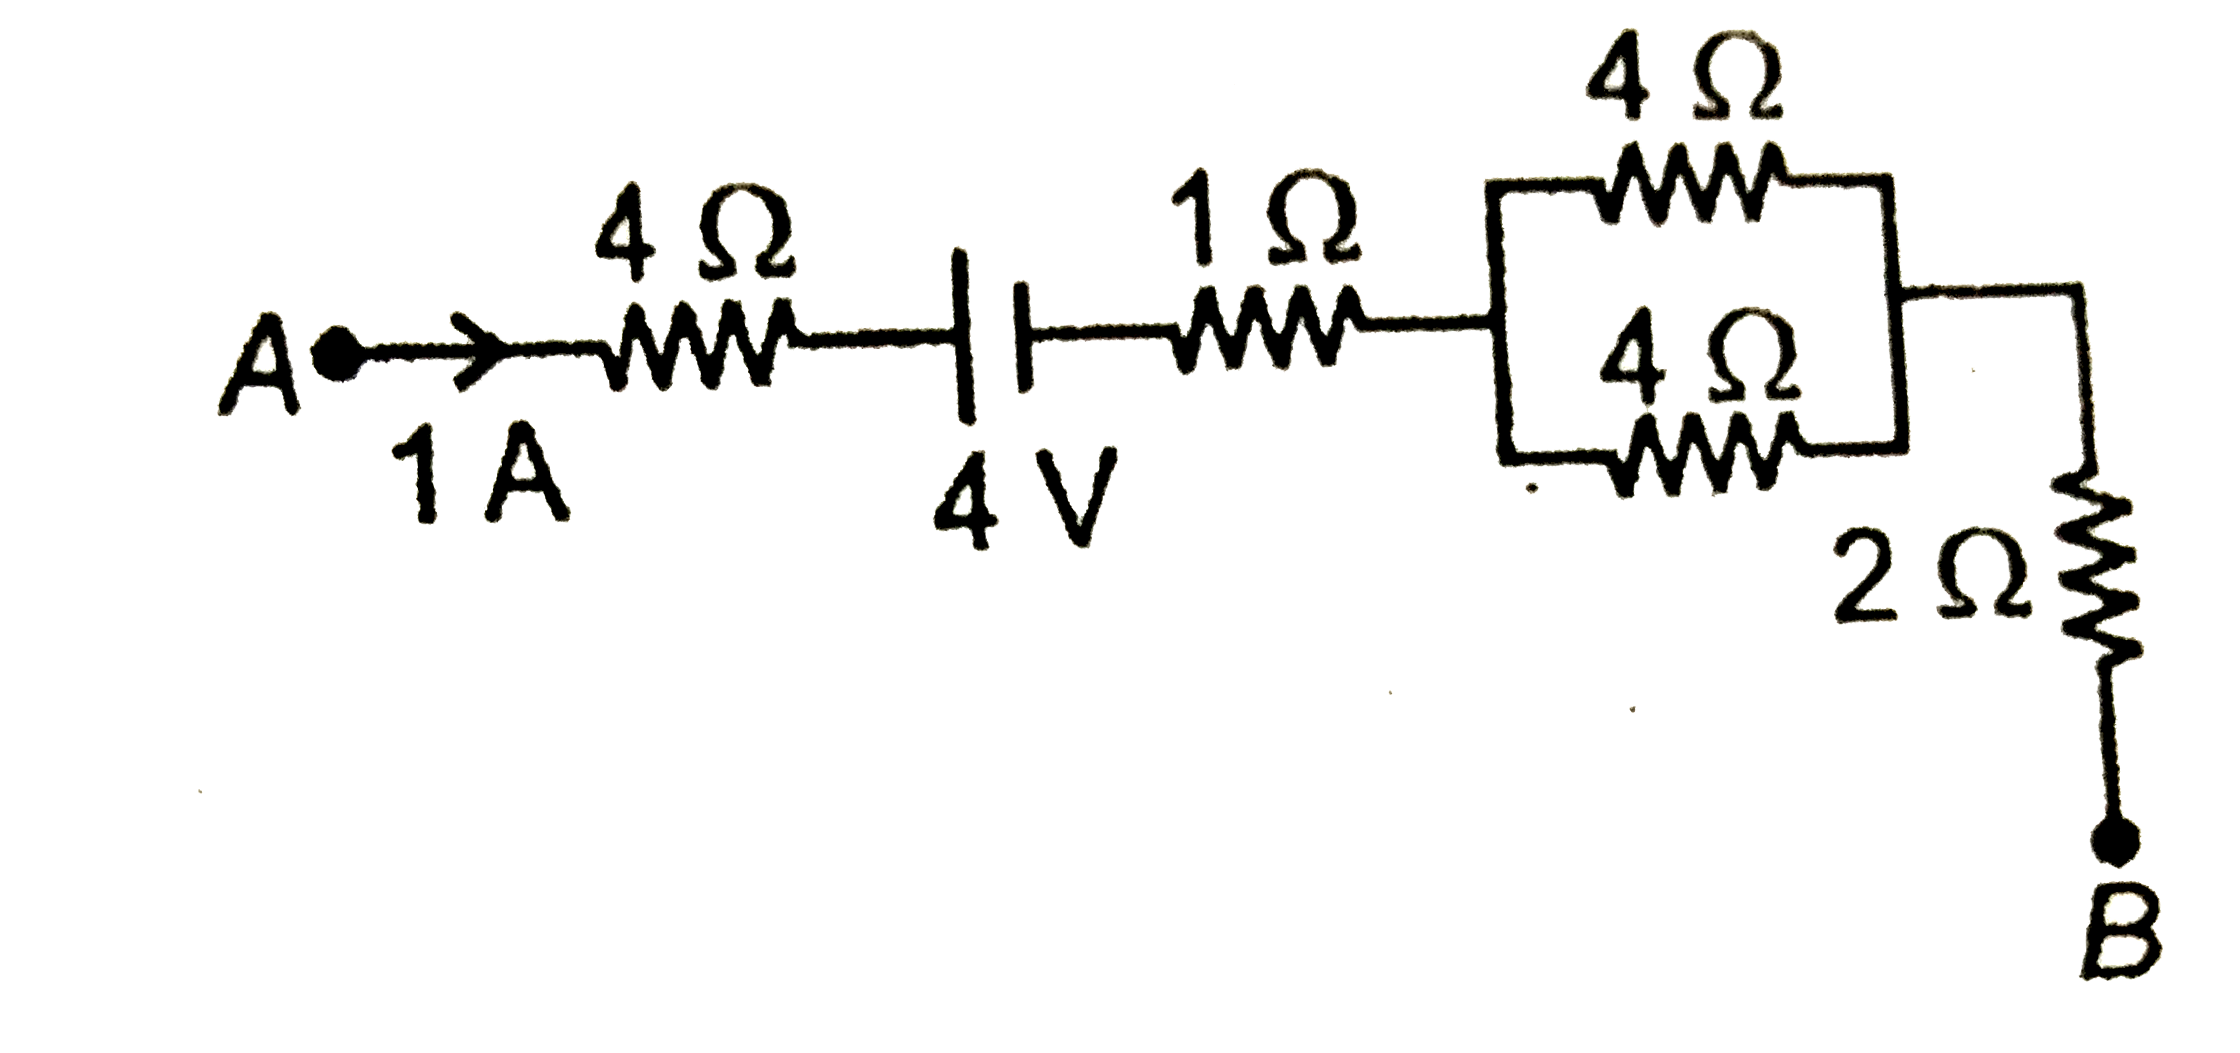
D) OhmView SolutionThe potential difference (VA−VB) between the point A and B as shown in the figure is
 View Solution
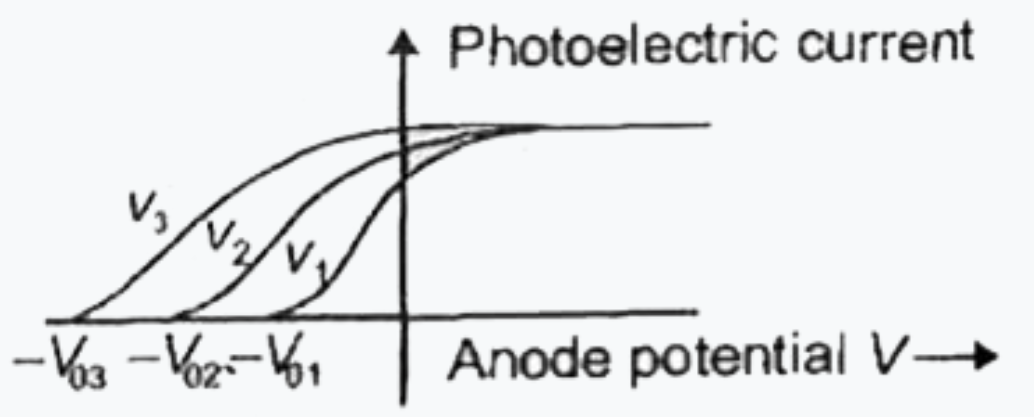
In photoelectric effect , the curve between photoelectric current and anode potential V (for different frequencies ) is shown in figure , then
 View Solution
The slope of the graph showing the variation of potential difference V on X-axis and current Y-axis gives conductor
View Solution
