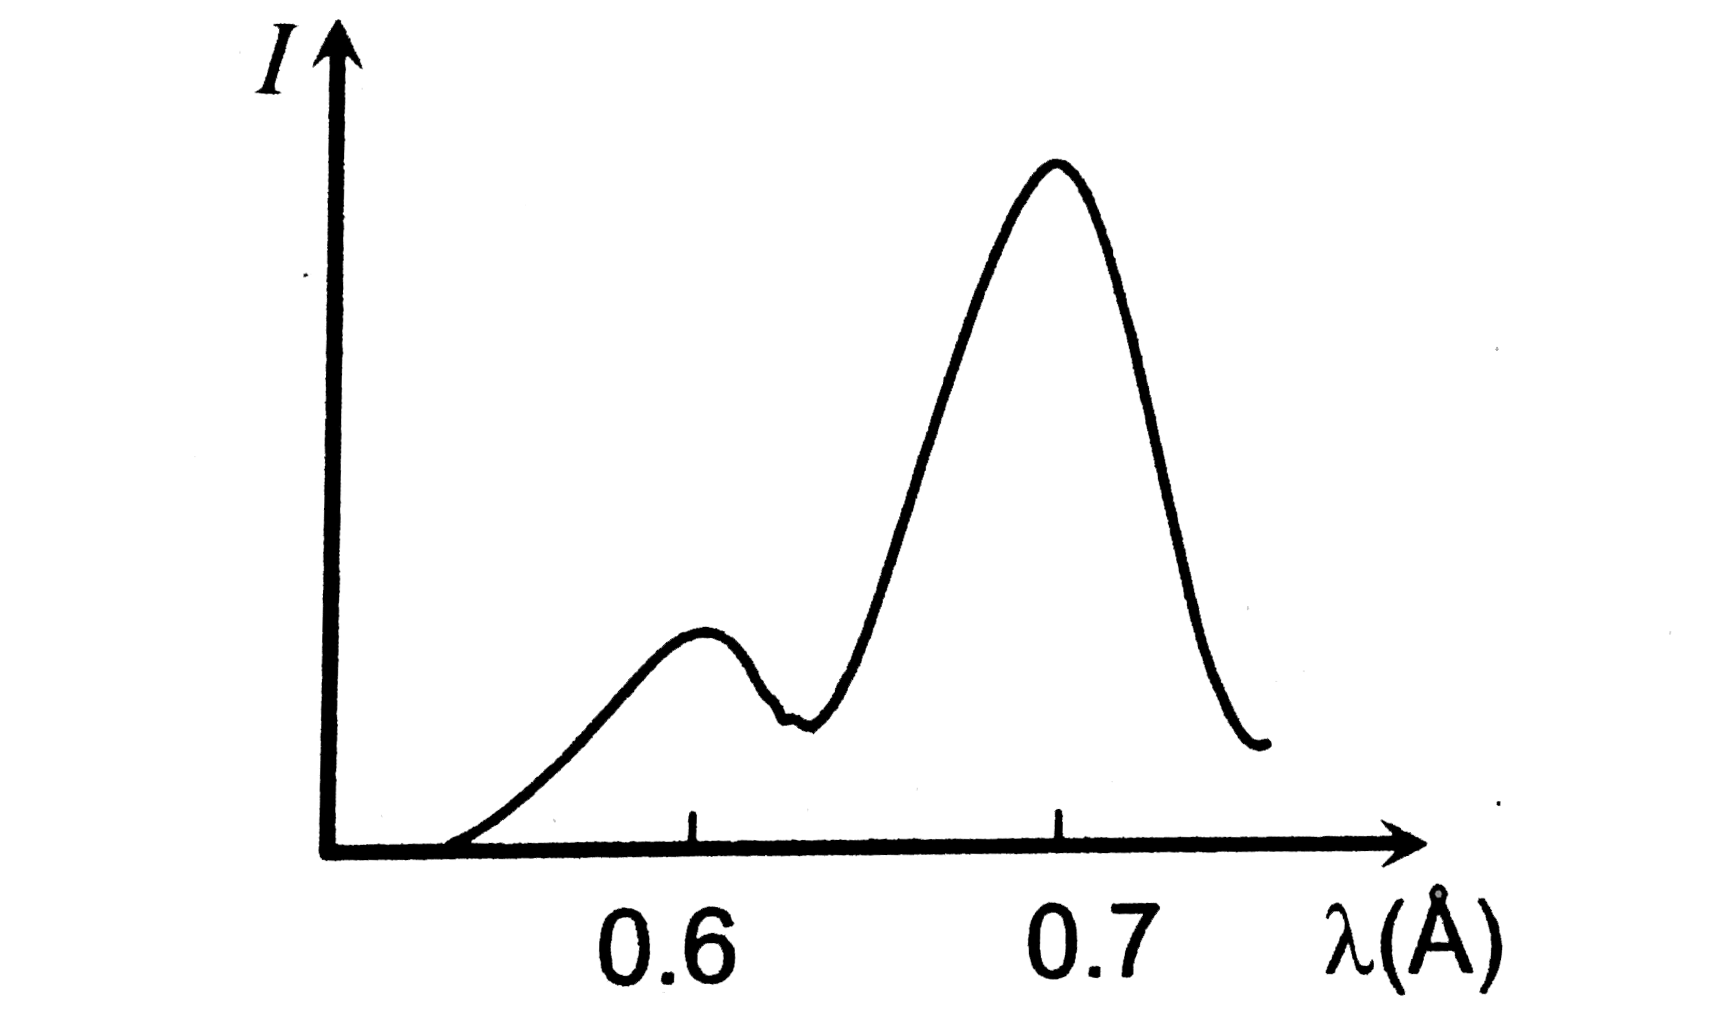
In the diagram a graph between the intensity of X-rays emitted by a molybdenum target and the wavelength of 30 keV are incident on the target. In the graph one peak is of Kα line and the other peak is of Kβ line

First peak is of Kα line at 0.6Å
Highest peak is of Kα line at 0.7Å
If the energy of incident particles is increased, then the peaks will shift towards left
If the energy of incident particles is increased, then the peaks will shift towards right
The correct Answer is:B
Peak of Kα is greater than peak of Kβ line.
Topper's Solved these Questions
- ELECTRON, PHOTON, PHOTOELECTRIC EFFECT & X -RAYBOOK - ERRORLESSCHAPTER - ELECTRON, PHOTON, PHOTOELECTRIC EFFECT & X -RAYEXERCISE - PAST YEARS QUESTIONS
71 Videos
- ELECTRON, PHOTON, PHOTOELECTRIC EFFECT & X -RAYBOOK - ERRORLESSCHAPTER - ELECTRON, PHOTON, PHOTOELECTRIC EFFECT & X -RAYEXERCISE - ASSERTION & REASON
27 Videos
- ELECTRON, PHOTON, PHOTOELECTRIC EFFECT & X -RAYBOOK - ERRORLESSCHAPTER - ELECTRON, PHOTON, PHOTOELECTRIC EFFECT & X -RAYEXERCISE - NCERT BASED QUESTIONS (Photon and Photoelectric Effect)
78 Videos
- ELECTROMAGNETIC INDUCTIONBOOK - ERRORLESSCHAPTER - ELECTROMAGNETIC INDUCTIONEXERCISE - ASSERTION & REASON
20 Videos
- ELECTRONICSBOOK - ERRORLESSCHAPTER - ELECTRONICSEXERCISE - Assertion & Reason
26 Videos
Similar Questions
Knowledge Check
In the diagram a graph between the intensity of X-rays emitted by a molybdenum target and the wavelength is shown , when electrons of 30keV are incident on the target. In th egraph one peak is of Kα line and the other peak is of Kβ line
 AFirst peak is of Kα line at 0.6ÅBHighest peak is of Kα line at 0.7ÅCIf the energy of incident particles is increased , then the peaks will shift towards leftDIf the energy of incident particles is increased , then the peaks will shift towards right
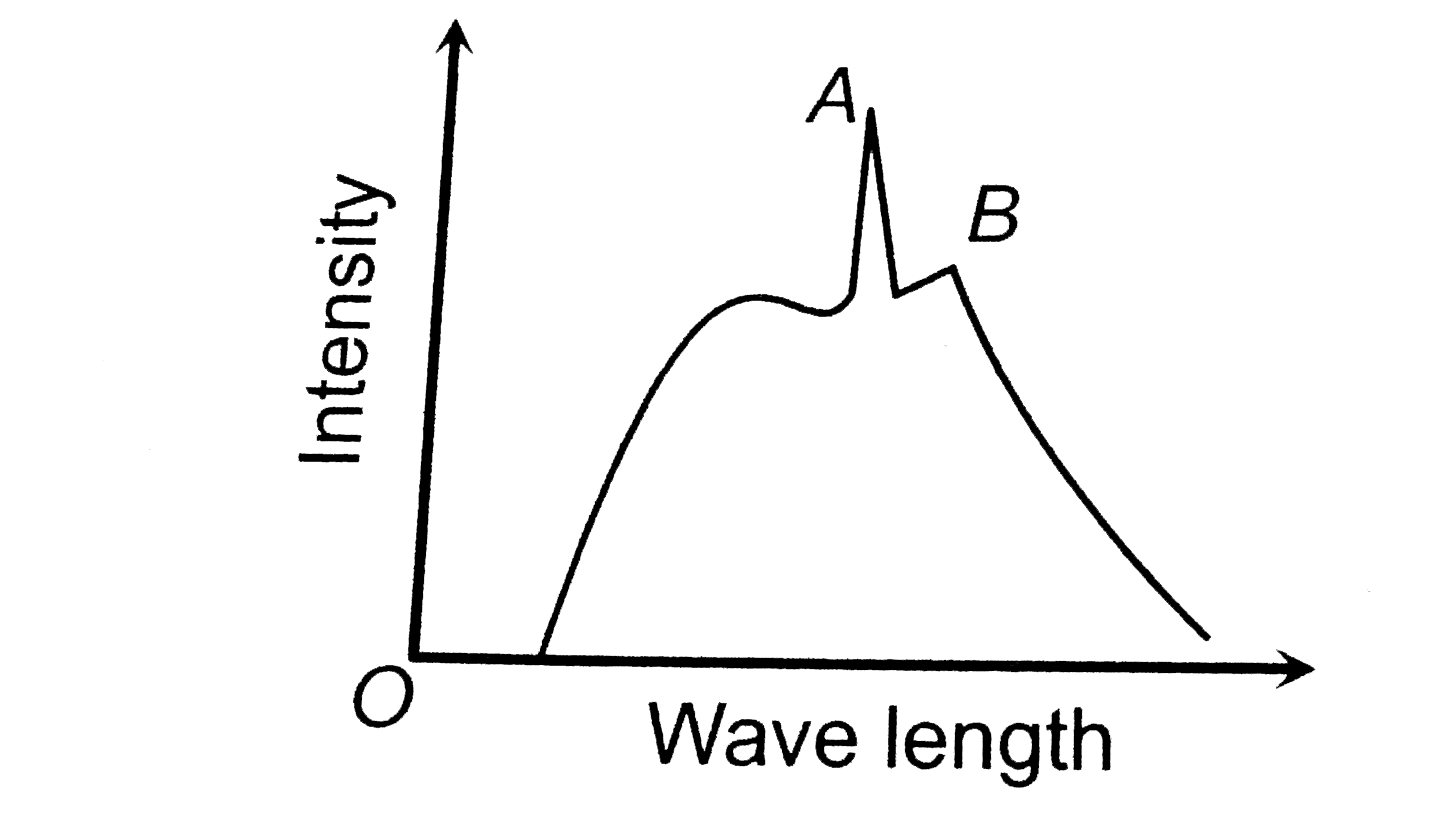
The figure represents the observed intensity of X - rays emitted by an X - ray tube as a function of wavelength . The sharp peaks A and B denote
 ABand spectrumBContinuous spectrumCCharacteristic radiationsDWhite radiations
In the X-rays produced by a Coolidge tube let λC be the cut-off wavelength , λα be the wavelength of the Kα line and λβ be the wavelength of the Kβ the.
Aλβ>λα>λCBλα>λβ>λCCλα>λC>λβDλβ>λC>λα
The x rays shown are produced when 35.0 ke V electrons strike a molybdenum (Z=42) target. If the accelerating potential is maintained at this value but a silver (Z=47) target is used instead, what values of (a) λmin, (b) the wavelength of the Kα line, and (c ) the wavelength of the Kβ line result? The K, L, and M atomic x-ray levels for silver are 25.51, 3.56, and 0.53 keV.
View SolutionThe wavelength of Kα –line characteristic X–rays emitted by an element is 0.32Å. The wavelength of Kβ–line emitted by the same element will be :–
View SolutionA The wavelength of the Kα line ofthe characteristic X rays emitted by an element is 0.64 Å . What is the wavelength of Kβ line emitted by the same element?
View SolutionIn an x-ray tube, electrons with energy 35 keV are incident on a cobalt (Z=27) target. Determine the cutoff wavelength for x-ray production.
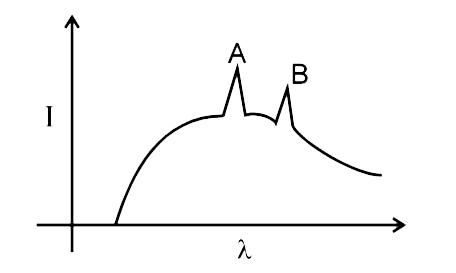
View SolutionFollowing diagram shows relation between emitted X-rays intensity and wavelength obtained X-ray tube its sharp peaks A and B shows

View Solution