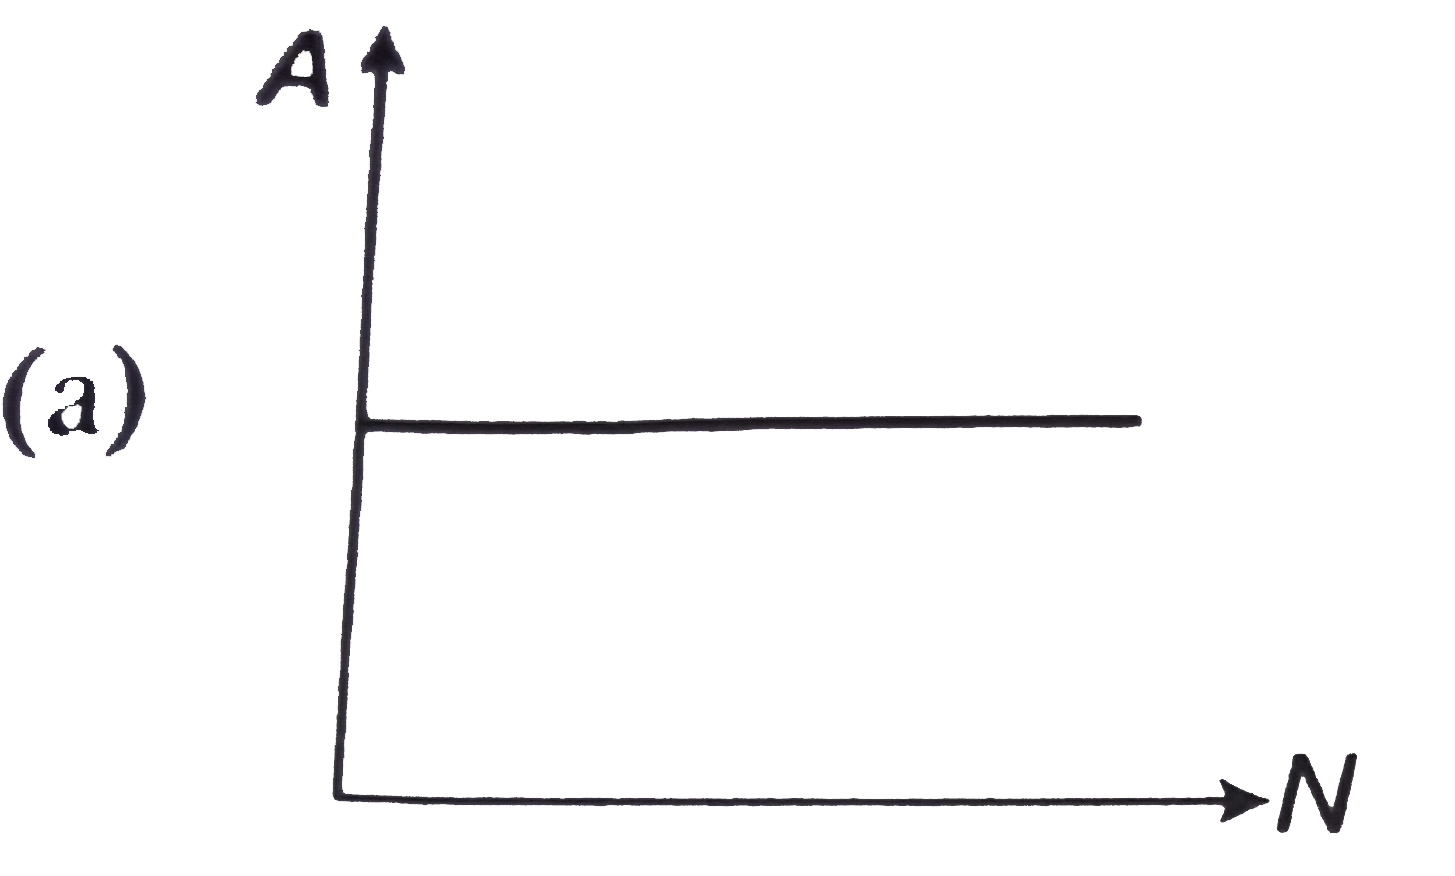
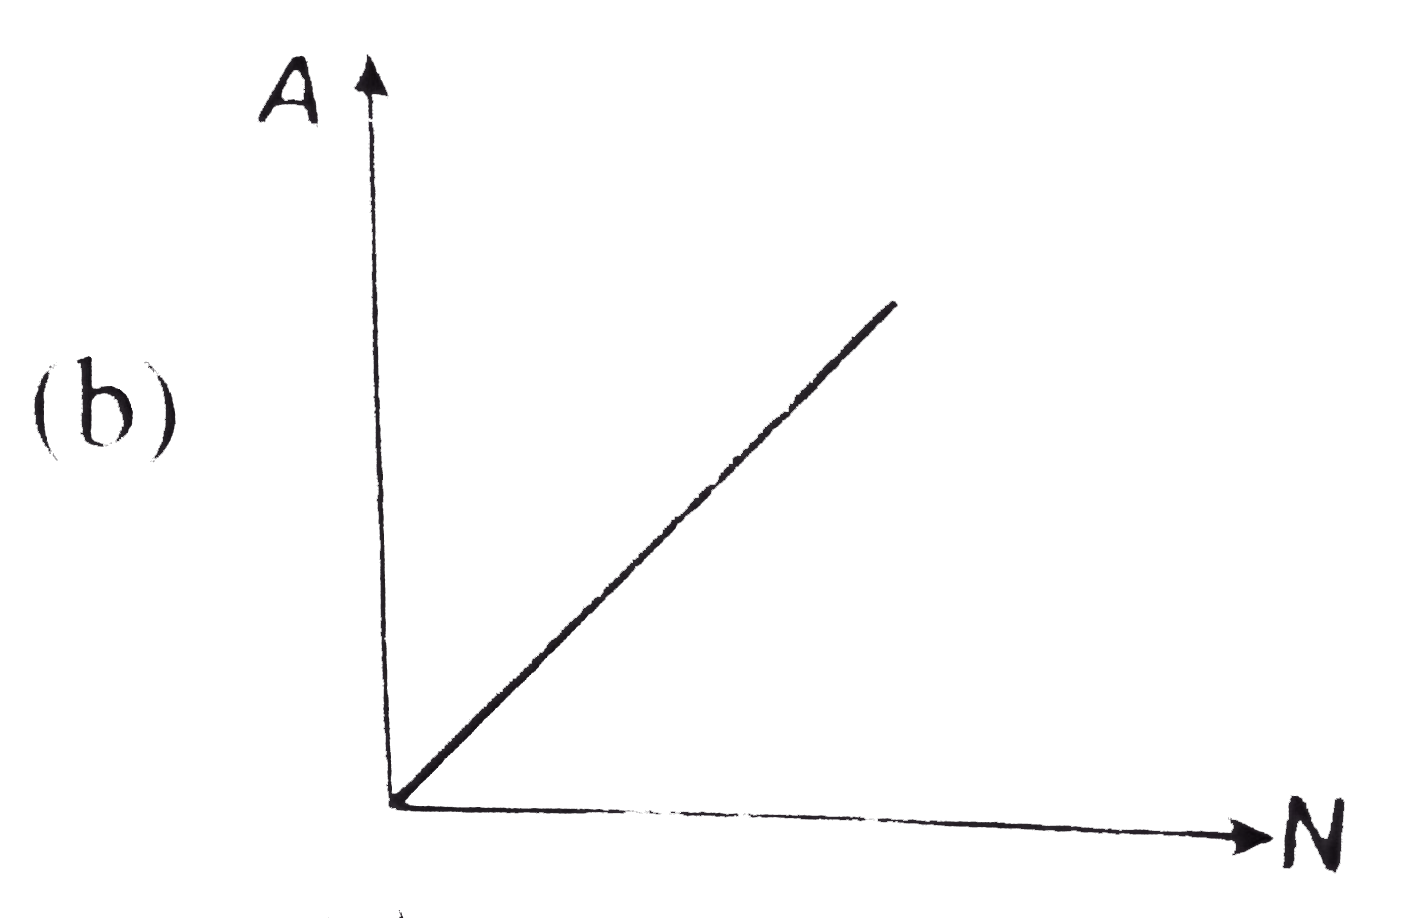
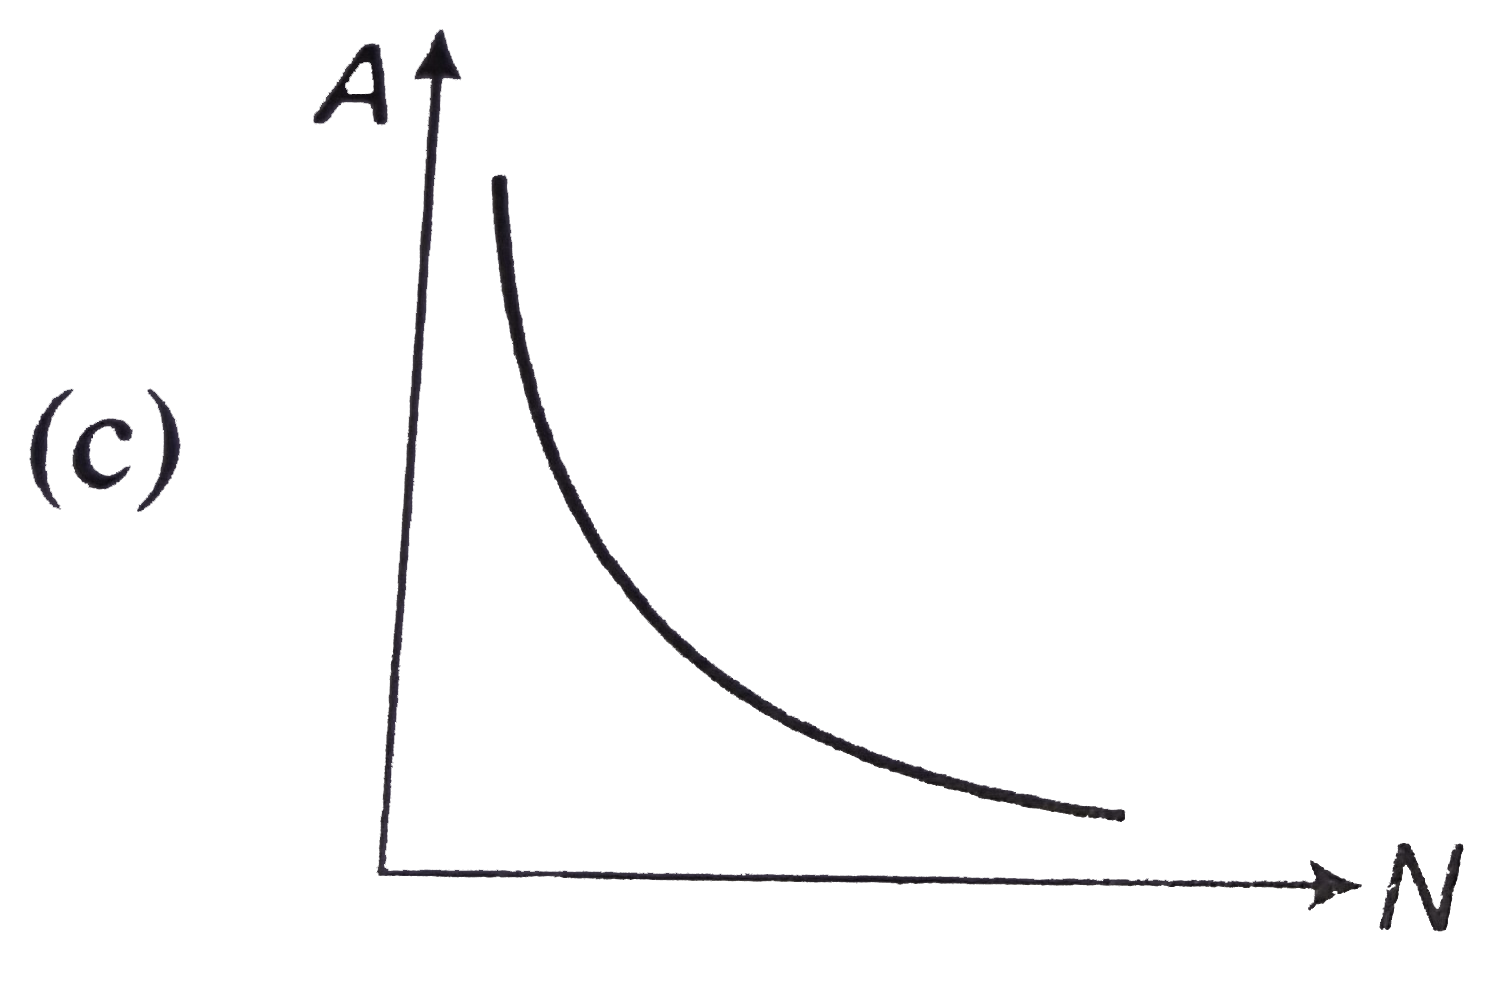
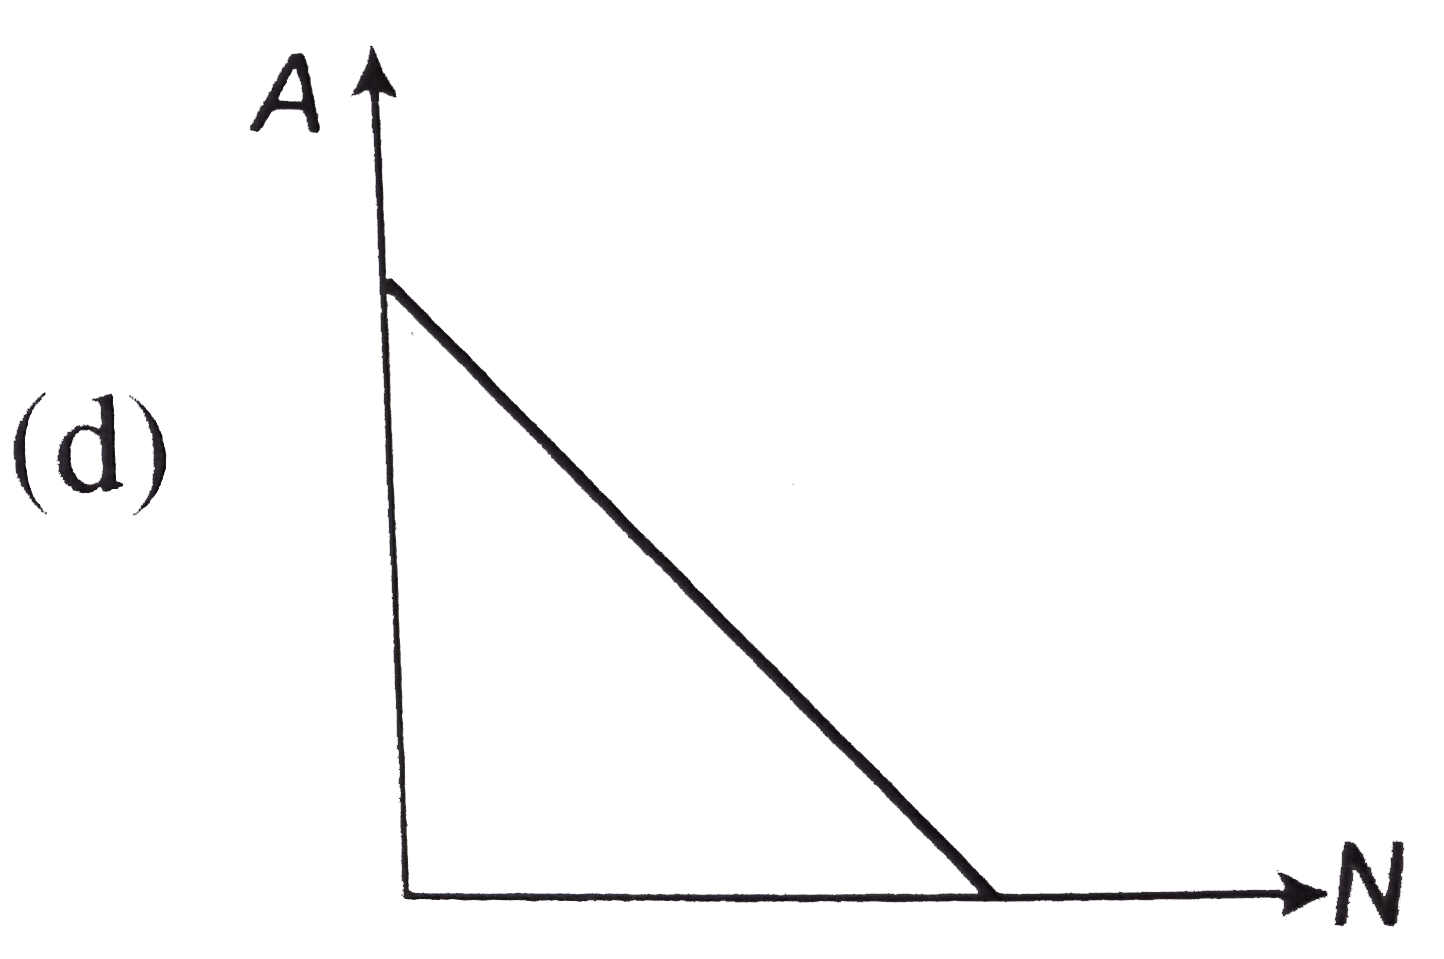
In Fig. X represents time and Y represent activity of a radioactive sample. Then the activity of sample, varies with time according to the curve

A
A
B
B
C
C
D
D
Video Solution
Text Solution
The correct Answer is:B
Activity =−dNdt=λN=λN0e−λt
|
Updated on:21/07/2023
Topper's Solved these Questions
- BOOK - ERRORLESSCHAPTER - ATOMIC AND NUCLEAR PHYSICSEXERCISE - Past Years Questions67videos
ATOMIC AND NUCLEAR PHYSICS
- BOOK - ERRORLESSCHAPTER - ATOMIC AND NUCLEAR PHYSICSEXERCISE - Assertion and Reason23videos
ATOMIC AND NUCLEAR PHYSICS
- BOOK - ERRORLESSCHAPTER - ATOMIC AND NUCLEAR PHYSICSEXERCISE - NCERT BASED QUESTIONS (Nucleus, Nuclear Reaction)57videos
ATOMIC AND NUCLEAR PHYSICS
- BOOK - ERRORLESSCHAPTER - ALTERNATING CURRENTEXERCISE - Assertion & Reason13videos
ALTERNATING CURRENT
- BOOK - ERRORLESSCHAPTER - CURRENT ELECTRICITYEXERCISE - ASSERTION AND REASON26videos
CURRENT ELECTRICITY
Similar Questions
Knowledge Check
- Question 1 - Select One
The activity of a radioactive sample
A1. Can be increased by heating itB2. Can be decreased by using a reducing agentC3. Can be increased by cooling itD4. Cannot be increased or decreased by any method - Question 2 - Select One
The activity of a radioactive sample is independent of
Athe mass number of the nucleusBthe mass of the sampleCthe number of atoms in the sampleDthe physical conditions - Question 3 - Select One
The curve between the activity A of a radioactive sample and the number of active atoms N is.
A B
B C
C D
D
How many atoms decay in one mean life time of a radioactive sample-
View SolutionThe activity of a radioactive sample drops fo 1/32 of its initial value in 7.5 h. Find the half life ?
View SolutionThe activity of a radioactive sample goes down to about 6% in a time of 2 hour. The half-life of the sample in minute is about
View SolutionLet T be the mean life of a radioactive sample. 75% of the active nuclei present in th sample initially will deacy in time
View SolutionIn the previous question , the activity of the sample after time t will be
View Solution

